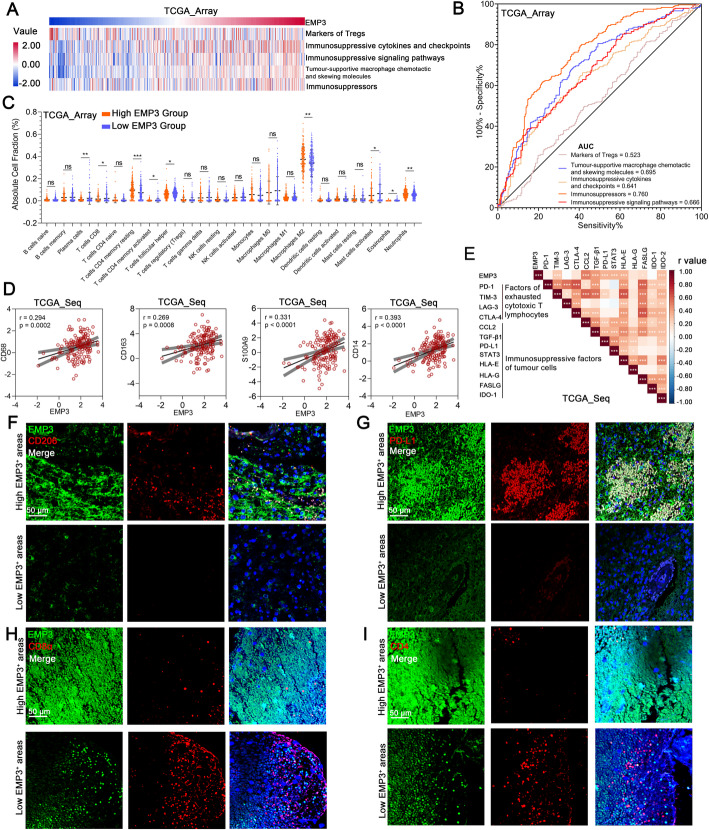
Fig. 1.
EMP3 is associated with immunosuppression in GBM. a Pearson correlation analysis of the expression of EMP3 with GBM-associated immunosuppressive metagenes in the TCGA_array GBM dataset (n = 475). b ROC curves indicated that high EMP3 was involved in immunosuppression in the TCGA_array GBM dataset (n = 475). c Immune cell fractions were estimated using CIBERSORT, and the differences between the cell fractions of the high and low EMP3 groups in the TCGA_array GBM dataset were evaluated using Student’s t-test (n = 475). d Pearson correlation plots of the expression of EMP3 with M2 TAM signature markers (CD68, CD163, S100A9, and CD14) in the TCGA_array GBM dataset (n = 475). e Correlation coefficient graph revealing the correlations of EMP3 with common immunosuppressive factors in the TCGA_seq GBM dataset (n = 153). f Representative images of immunofluorescence (IF) staining for EMP3 and CD206 in different areas of serial sections from human GBM samples (n = 27). Scale bar = 50 μm. g Representative images of IF staining for EMP3 and PD-L1 in different areas of serial sections of human GBM samples (n = 27). Scale bar = 50 μm.h Representative images of IF staining for EMP3 and CD8α in different areas of serial sections from human GBM samples (n = 27). Scale bar = 50 μm. I. Representative images of IF staining for EMP3 and CD4 in different areas of serial sections of human GBM samples (n = 27). Scale bar = 50 μm. The mean ± S.D. is shown. Ns: nonsignificant, *p < 0.05, **p < 0.01, and ***p < 0.001

