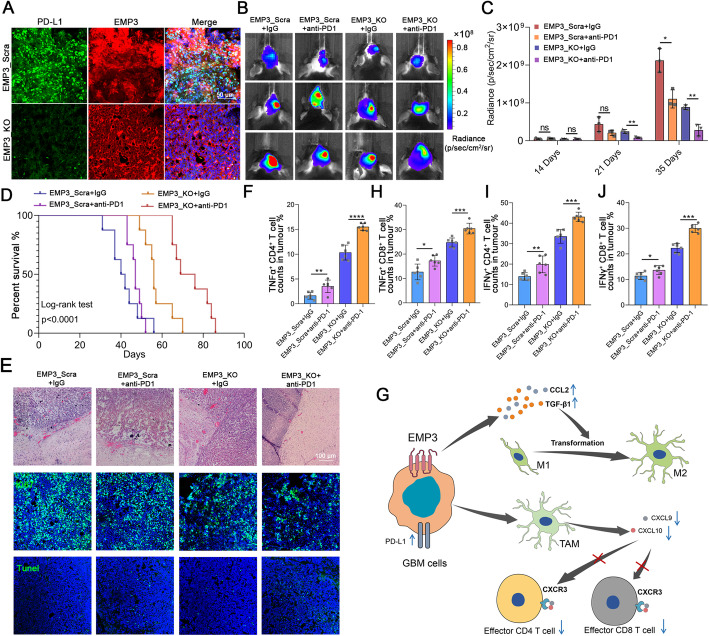
Fig. 6.
Knockout of EMP3 and immune checkpoint blockade have synergistic antitumorigenic effects. a Representative images of IF staining for EMP3 and PD-L1 in mouse brain tissues from the EMP3_KO and EMP3_Scra GL261 groups. Scale bar = 50 μm. KO: Knockout; Scra: Scramble. b Bioluminescence images of EMP3_KO and EMP3_Scra C57BL/6 mice treated with isotype IgG or PD1 blockade. KO: Knockout; Scra: Scramble. c Quantification of the bioluminescence imaging signal intensities in C57BL/6 mice. Student’s t-test was performed. d Kaplan-Meier survival curves of mice bearing intracranial EMP3_KO or EMP3_Scra GL261 tumours treated with an anti-PD1 antibody or isotype IgG. KO: Knockout; Scra: Scramble. The log-rank test was performed. e Tumour sections from the EMP3_KO and EMP3_Scra GL261 groups treated with the anti-PD1 antibody or isotype IgG were used for a TUNEL assay, IF staining and H&E analysis. Upper: Fluorescence images of TUNEL staining in tumours. Middle: Representative images of IF staining for Ki67 in tumours. Lower: H&E staining of tumour sections. Scale bar = 100 μm.f-h Percentages of TNFα+ CD4+ and TNFα+ CD8+T cells in tumours from the EMP3_KO and EMP3_Scra GL261 groups treated with the anti-PD1 antibody or isotype IgG. Student’s t-test was performed. KO: Knockout; Scra: Scramble. i-j Percentages of IFN-γ+ CD4+and IFN-γ+ CD8+ T cells in tumours from the EMP3_KO and EMP3_Scra GL261 groups treated with the anti-PD1 antibody or isotype IgG. Student’s t-test was performed. KO: Knockout; Scra: Scramble. g Schematic showing that EMP3 mediates TAM infiltration to suppress T cell infiltration. The mean ± S.D. is shown. Ns: nonsignificant, *p < 0.05, **p < 0.01, and ***p < 0.001

