
Figure 1.
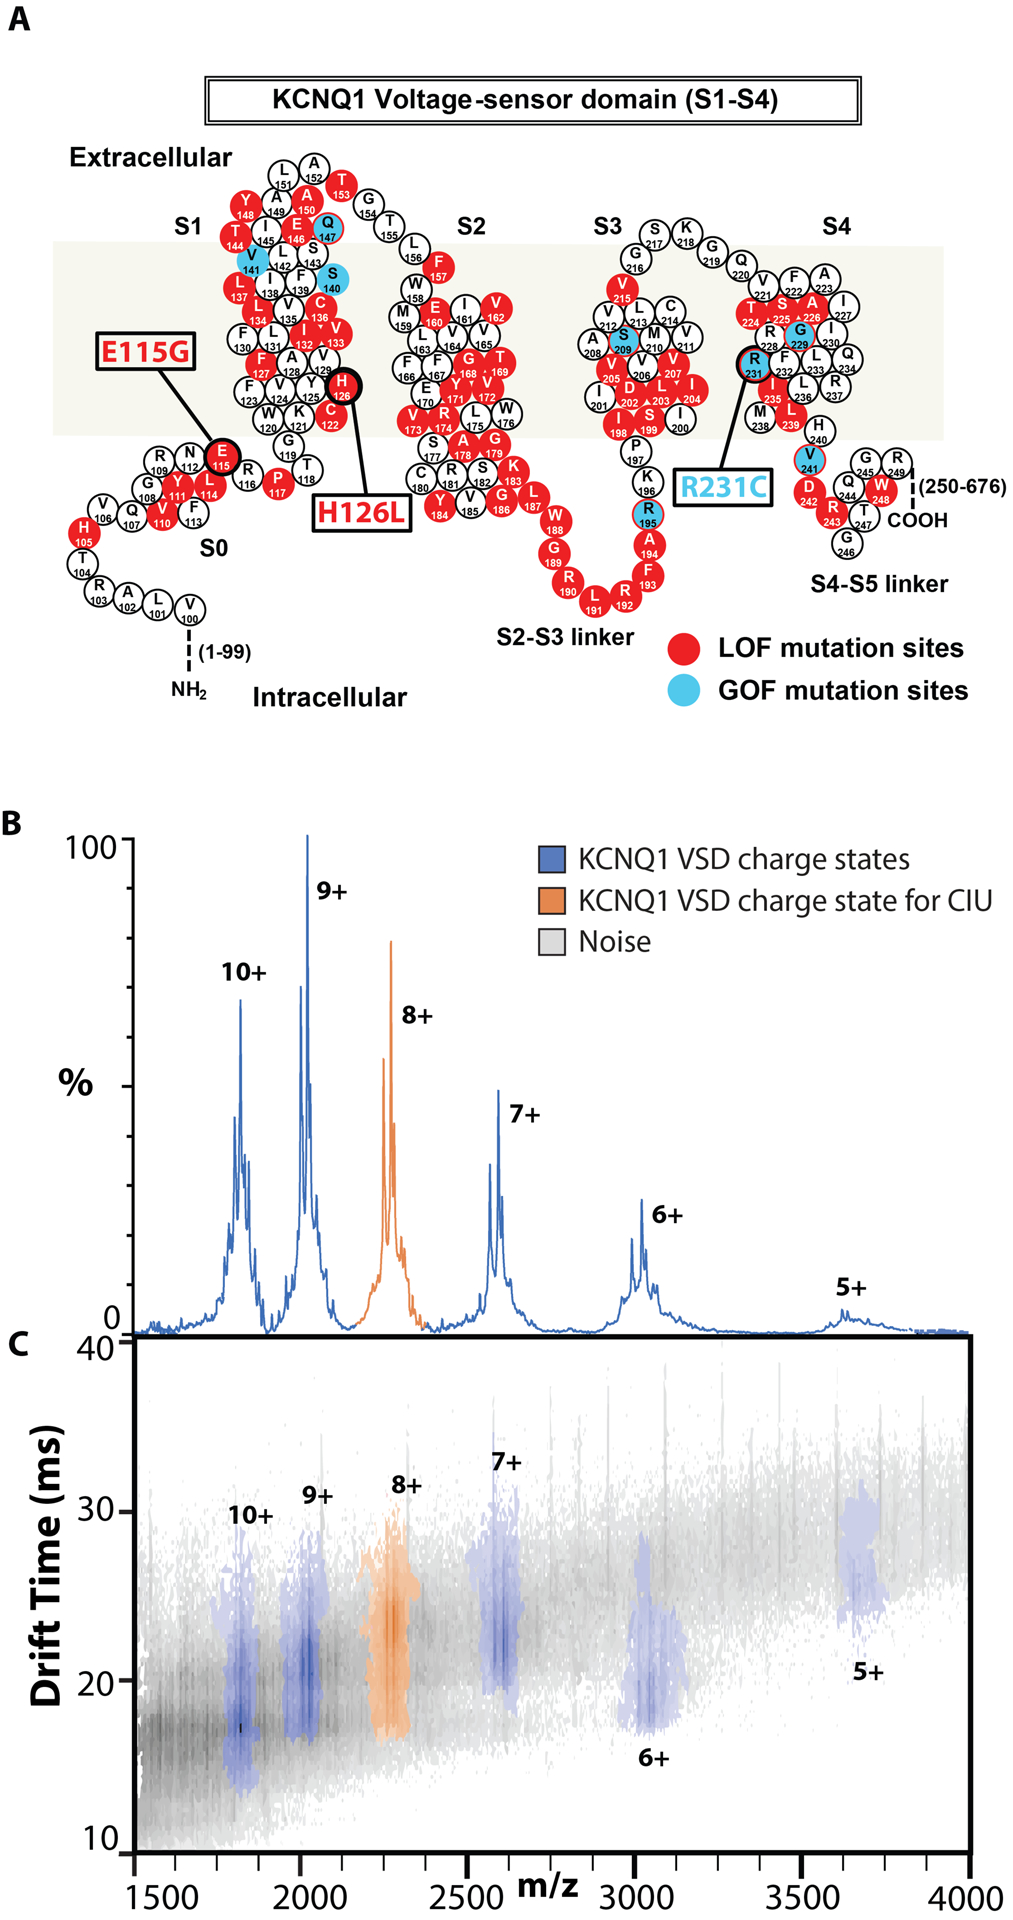
Native IM-MS of the KCNQ1 VSD. A. Sequence and structure of the KCNQ1 VSD with residues known to mutate and result in disease phenotypes associated with LOF (red) or GOF (blue). Variants E115G, H126L, and R231C are studied in this work. B,C. Representative mass spectra and IM-MS data for WT KCNQ1 at 80 V trap collision voltage. One distribution of charge states, 5–10+, is observed for all variants corresponding to KCNQ1 VSD monomers (Figure S2). The charge state envelope and CCS analysis indicate native like folding, and the 8+ charge state (orange) was chosen for further analysis.