
Fig. 1.
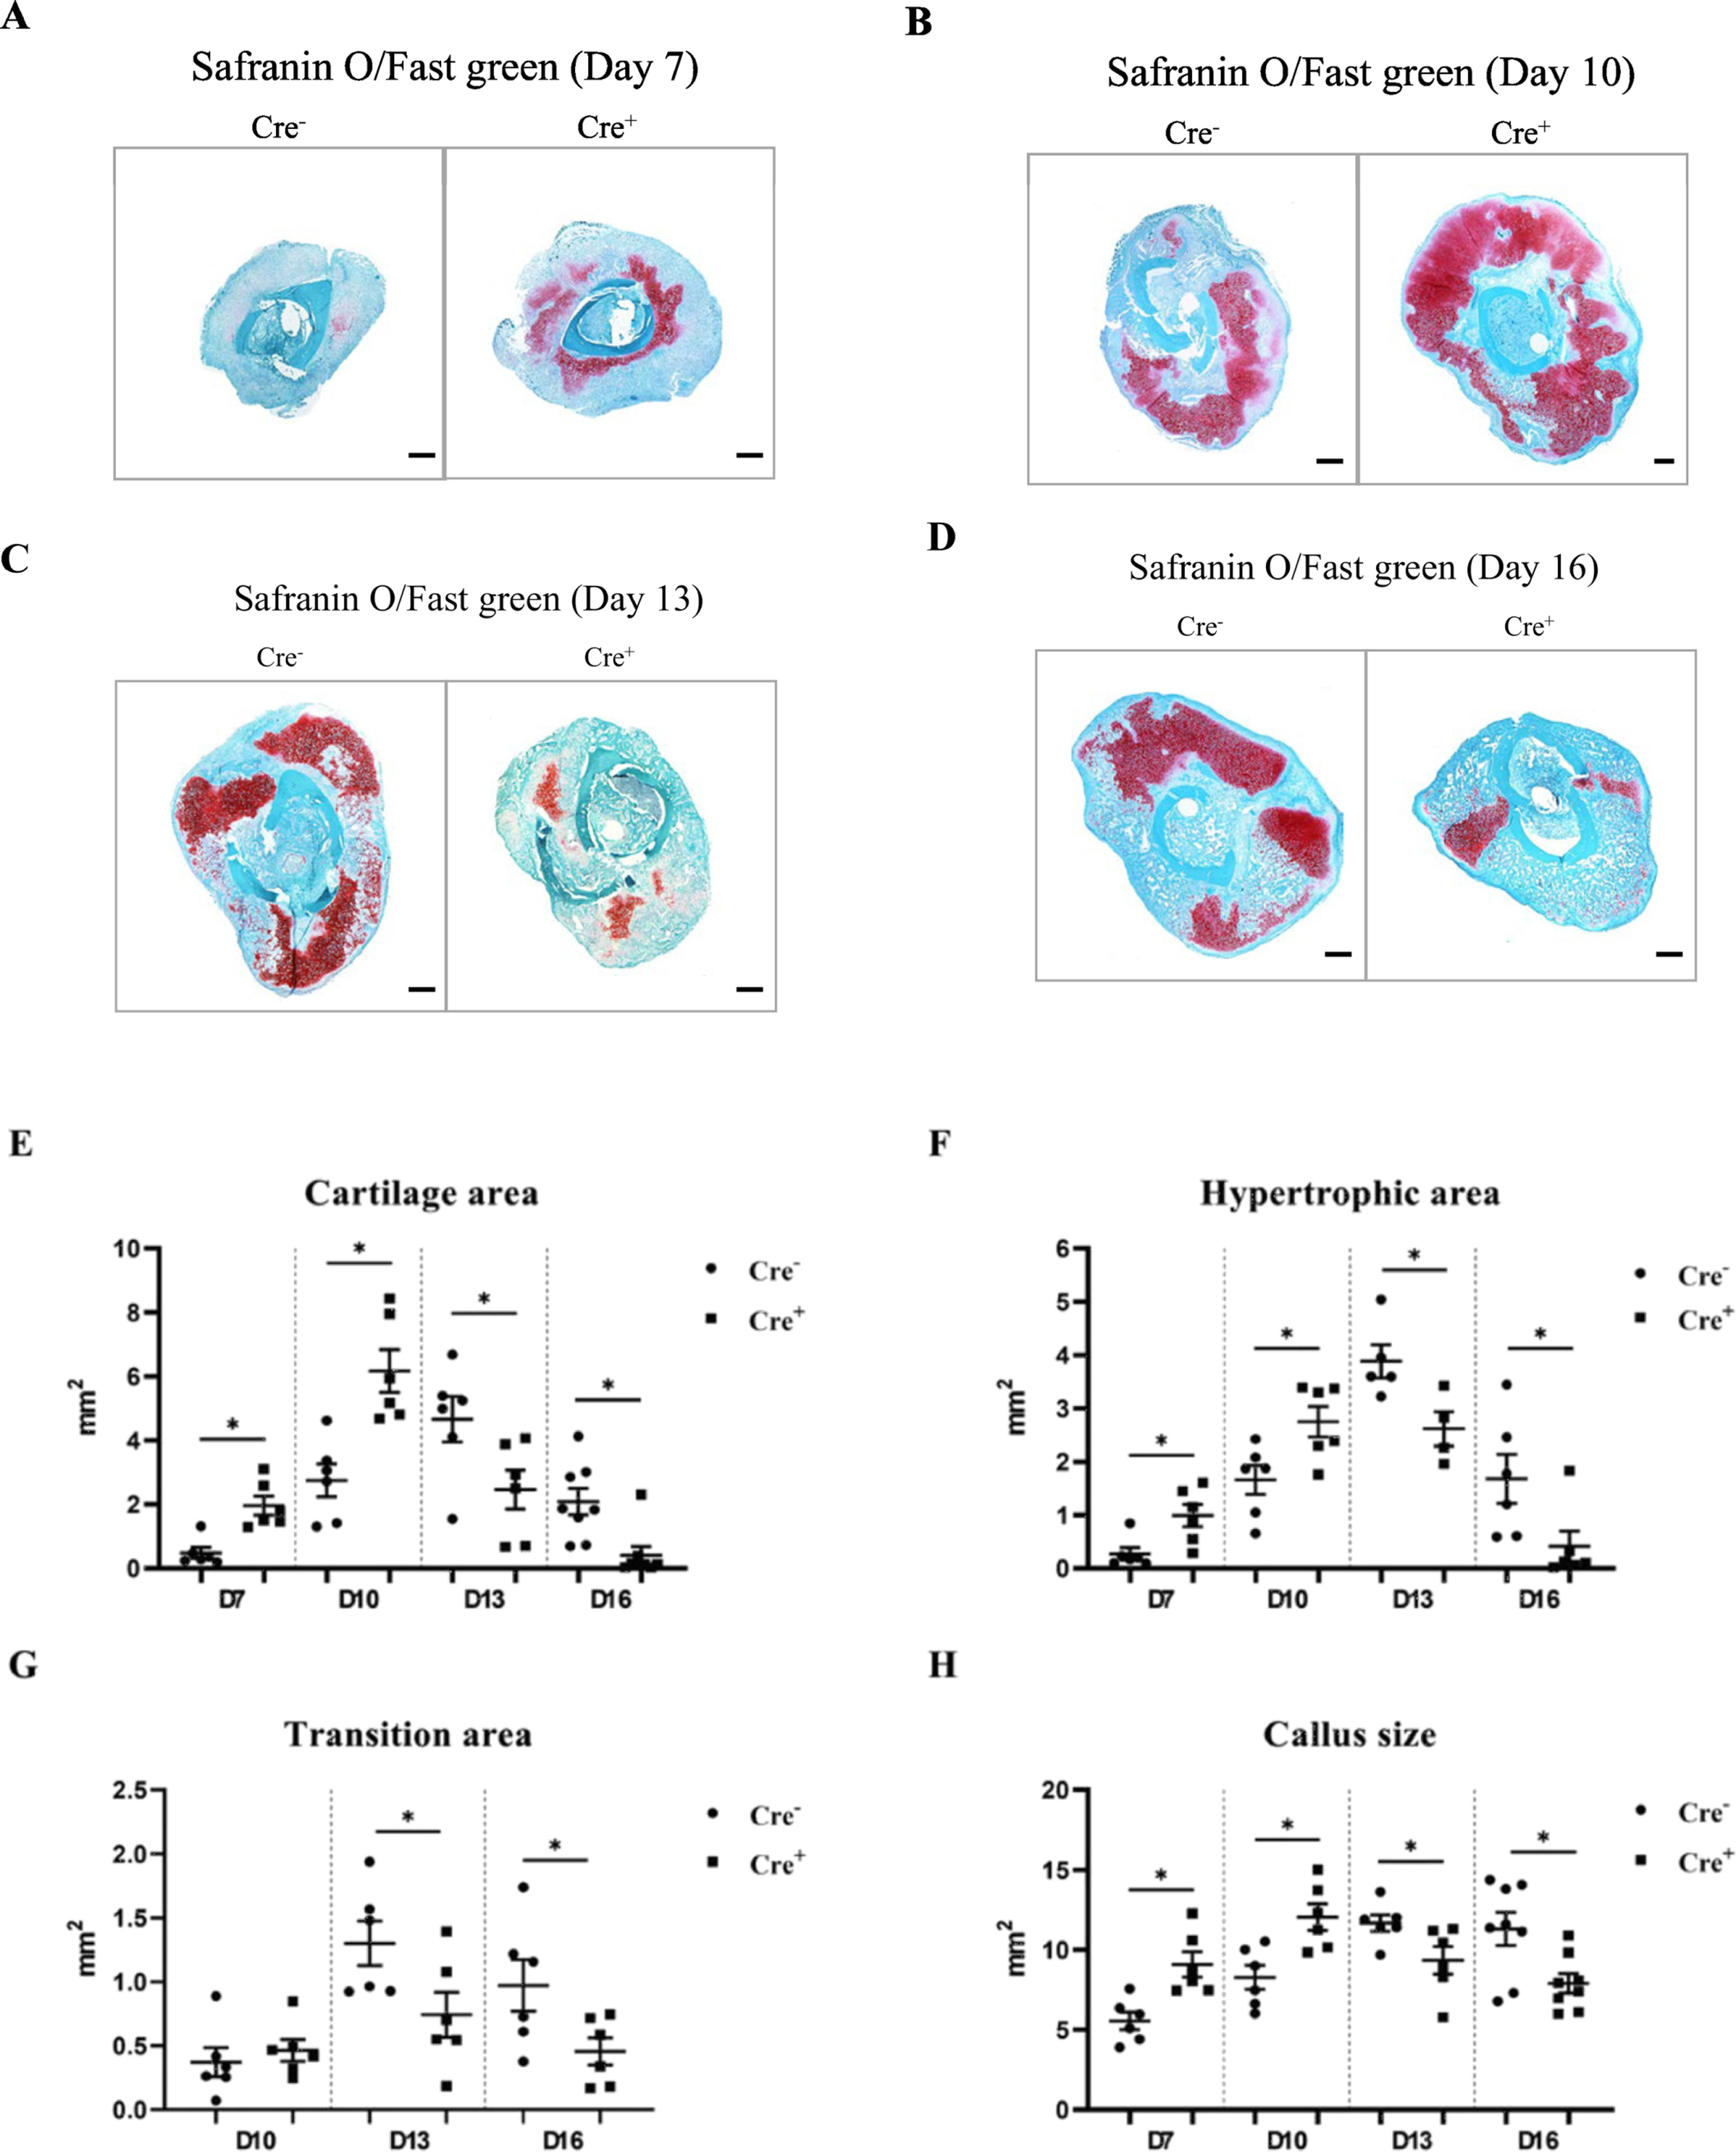
FOXO1 deletion in chondrocytes increases both cartilage formation and loss. Safranin O/fast green histostaining was performed on sections from Col2α1Cre−FOXO1L/L and Col2α1Cre+FOXO1L/L mice on days 7, 10, 13 and 16 after the fracture. Histomorphometric analysis was carried out with computer-assisted image analysis. (A-D) Representative images that show the entire samples are composed of 4x images. Scale bars = 300 μm. (E) Cartilage area. (F) Areas of hypertrophic chondrocytes. (G) Area of the transition zone (chondro-osseous junction). (H) Callus area. Data are presented as the mean ± SE. * p < 0.05, n = 5–7 mice in each group. Cre− = Col2α1Cre−FOXO1L/L; Cre+ = Col2α1Cre+FOXO1L/L; D = days.