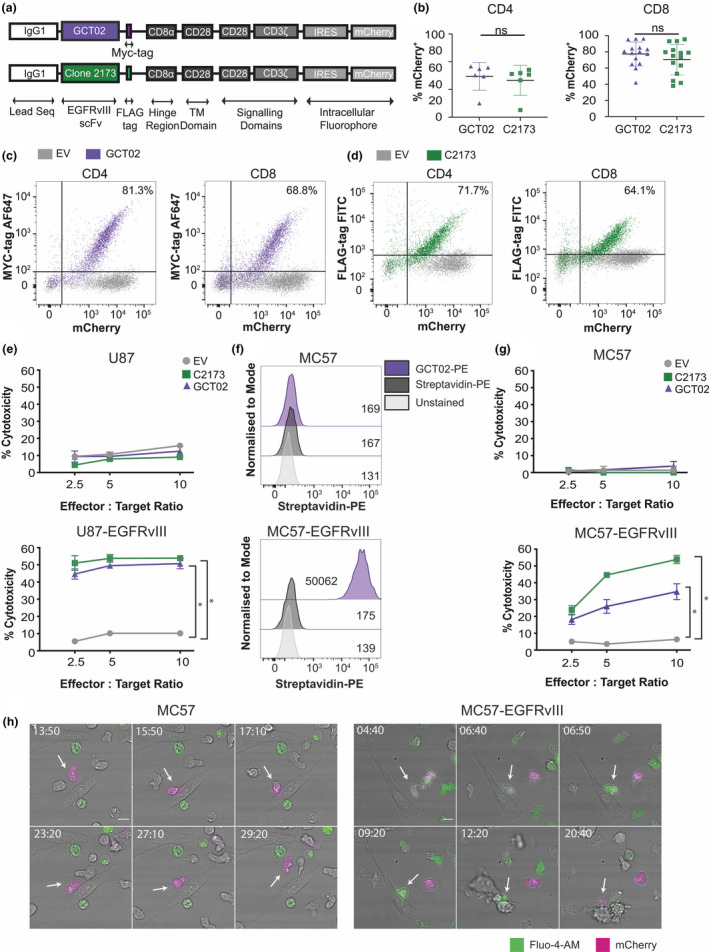
Figure 2.

Novel GCT02‐generated chimeric antigen receptor T cells are functional and EGFRvIII‐specific. (a) Schematic of the chimeric antigen receptor (CAR) construct design. CAR constructs are designed with an IgG1 leader sequence, either the GCT02 or C2173 scFv, a cell surface detectable tag (GCT02‐MYC and C2173‐FLAG), CD8α hinge region, CD28 transmembrane domains and CD28‐CD3ζ signalling domains, linked by IRES to the intracellular fluorophore mCherry. (b) Individual transduction efficiencies of the primary CD4+ (left) and CD8+ (right) GCT02 and C2173 murine CAR T cells, as determined by the expression of the intracellular fluorophore mCherry, as a marker of transduction. Transduction efficiency was measured by flow cytometry at days 4–7 post‐T cell activation. Each symbol is representative of one experiment. The mean ± SD transduction efficiency is shown. Statistical analysis was determined by the unpaired two‐tailed t‐test. Representative flow cytometry dotplots of CD4+ and CD8+ T cells at 6 days post‐activation, labelled with anti‐MYC for GCT02 (purple) or anti‐FLAG antibodies for C2173 (green), expressing either empty vector (EV, grey), or (c) GCT02‐MYC EGFRvIII CAR or (d) C2173‐FLAG EGFRvIII CAR. Plots show the expression of the cell surface detectable tag (MYC or FLAG, Y‐axis) and correlation with the intracellular fluorophore mCherry (X‐axis). Percentages in the top right quadrant indicate cells double positive for mCherry and the extracellular protein tag in cells transduced with the EGFRvIII CAR. (e) Cytotoxicity induced by CD8+ GCT02 or C2173 CAR T cells coincubated with chromium‐labelled human glioblastoma cell line U87 or U87‐EGFRvIII for 24 h. Shown is the mean ± SD, n = triplicate samples, representative of three independent experiments. The percentage cytotoxicity was normalised for mCherry expression as determined by flow cytometry. Statistical analysis was determined by the unpaired t‐test. *P‐value < 0.05. (f) Flow cytometry histograms of murine fibrosarcoma cell line MC57 and MC57‐EGFRvIII labelled with recombinant biotinylated GCT02‐PE or streptavidin‐PE control. The mean fluorescence intensity for each peak is shown. (g) Chromium release assay showing percentage cytotoxicity induced by CD8+ GCT02 or C2173 CAR T cells coincubated with chromium‐labelled murine fibrosarcoma cell line MC57‐EGFRvIII and MC57 for 4 h, at varying effector‐to‐target ratios. The mean ± SD is shown, n = triplicate samples, representative of three independent experiments. The percentage cytotoxicity was normalised for mCherry expression as determined by flow cytometry. Statistical analysis was determined by the unpaired t‐test. * P‐value < 0.05. (h) Representative time‐lapse microscopy montages of CD8+ GCT02 CAR T cell coincubated with MC57 (left) or MC57‐EGFRvIII (right) targets. T cells (mCherry+, magenta) are labelled with calcium flux indicator Fluo‐4 (green). Timestamps show min: sec. The scale bar is 10 μm. Note (left) T cells do not initiate cell death in MC57 culture, but (right) T cells induce target cell apoptosis against MC57‐EGFRvIII cells. The flow cytometry backgating is shown in Supplementary figures 9 and 10.
