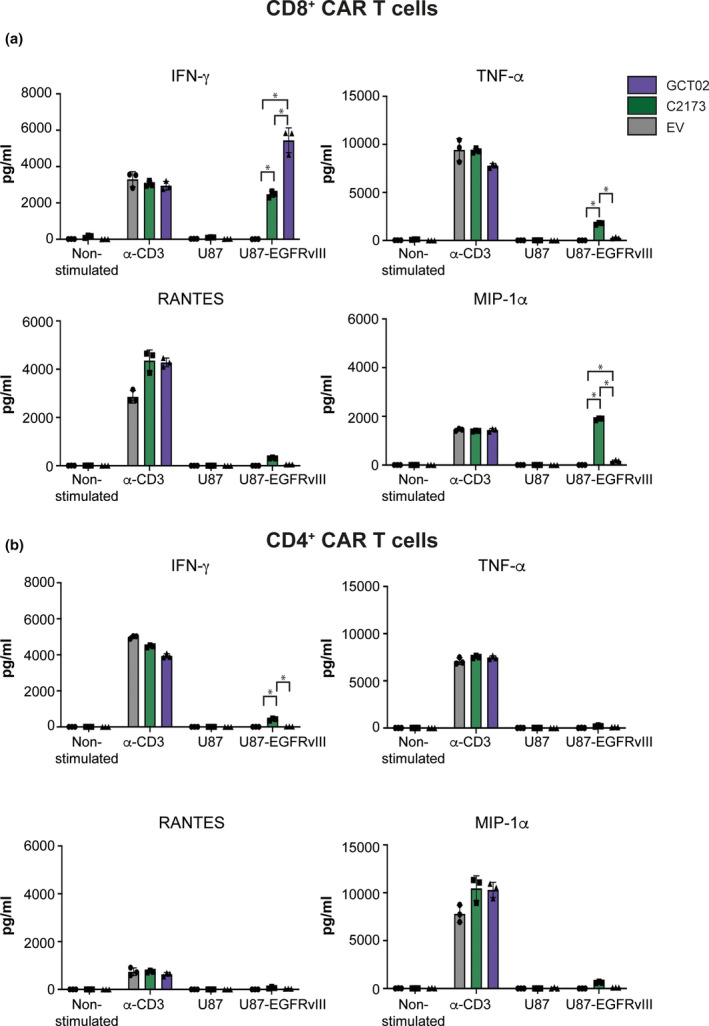
Figure 3.

Cytokine and chemokine secretion by CAR T cells. Cytokine bead array quantification after 24 h as assayed from cultures of purified (a) CD8+ or (b) CD4+ CAR T cells that were either activated by agonistic plate‐bound anti‐CD3 antibody as a maximum control, or cocultured with U87 or U87‐EGFRvIII target cells. Shown is the secreted amount of IFN‐γ, TNF‐α, RANTES and MIP‐1α in pg mL−1 of culture. Data are shown as mean ± SD, n = 3 technical replicates, and are representative of 4 experiments. Statistical analysis was determined by 2‐way ANOVA, multiple comparisons. * P‐value < 0.05.
