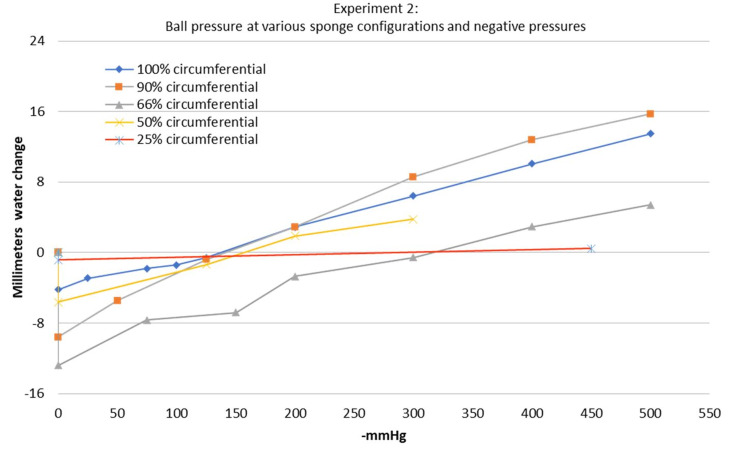
Figure 8. Experiment 2 - ball pressure at various sponge configurations and negative pressures.
The 0 on the y axis represents the baseline water level before applying negative pressure to the sponge. For this experiment, this baseline water level was 78 cm of water. Note how all of the sponge configurations resulted in an initial decrease in ball pressure and crossed the 0 level on the y axis at varying amounts of negative pressure. The intersection of this line at the 0 on the y axis represents the crossover point where the sponge crosses over from decreasing pressure to increasing pressure in the ball

