Fig. 3.
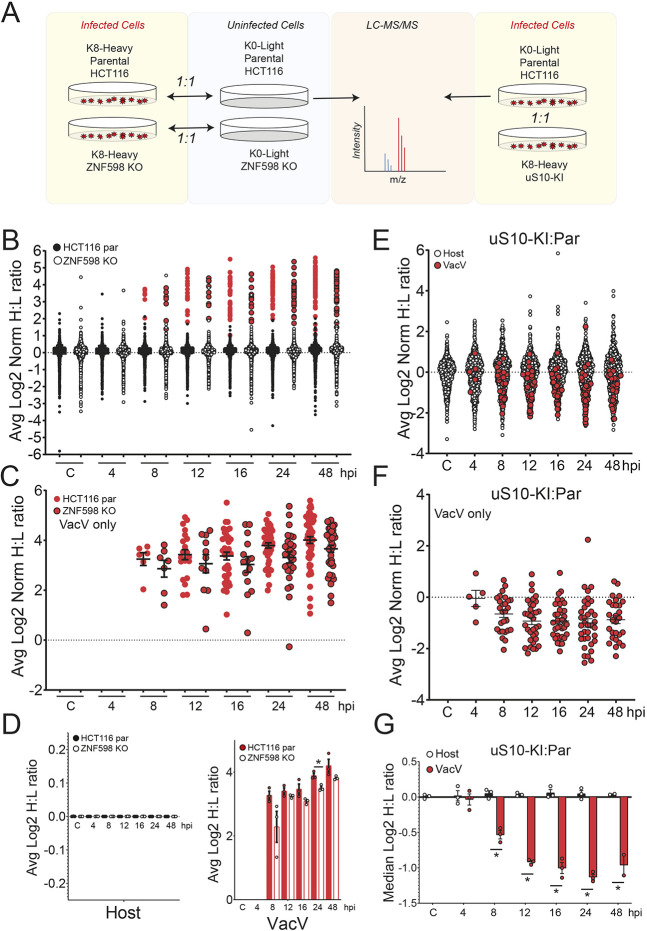
Proteomic characterization of vaccinia virus protein production in RQC-deficient cells. (A) Schematic showing the labeling strategy for the SILAC experiments. (B) Heavy-labeled parental (par; filled circles) or ZNF598 KO (open circles) HCT116 cells were infected with vaccinia virus (MOI=5), collected at the indicated time points post infection (hpi, hours post infection), and mixed 1:1 with light-labeled uninfected cells of the same genotype. Samples were analyzed by mass spectrometry, and normalized log2 heavy to light (H:L) ratios were determined for host (black) and vaccinia virus (VacV; red) proteins (Table S1). The mean normalized log2 H:L ratio for proteins across three replicate experiments is depicted. (C) Normalized log2 H:L ratios of VacV proteins from parental (red circles, no border) and ZNF598 KO (red circles, black border) cells infected with VacV (MOI=5) at the indicated time points (Table S2). The mean normalized log2 H:L ratio for proteins across three replicate experiments is depicted. Black bars denote the mean of all VacV H:L ratios at a given time point with error bars representing s.e.m. (D) The mean normalized log2 H:L ratio for host (left) or VacV (right) proteins in parental (filled black or red bars) or ZNF598 KO (unfilled bars) cells at each time point. Error bars denote s.e.m. for triplicate experiments. *P<0.05 (two-tailed, unpaired Student's t-test). (E,F) Light-labeled parental cells and heavy-labeled uS10-KI cells were infected with vaccinia virus, collected at the indicated time points post infection, and mixed 1:1. Samples were analyzed by mass spectrometry, and mean normalized log2 H:L ratios were determined for (E) host (open) and VacV (filled red) proteins (Table S3) or (F) just VacV proteins (Table S4). The mean normalized log2 H:L ratio for proteins across three replicate experiments is depicted. Black bars in F denote the mean of all VacV H:L ratios at a given time point with error bars representing s.e.m. (G) The median normalized log2 H:L (parental:uS10-KI) ratio for host (black bars) or VacV (red bars) proteins at each time point. Error bars denote s.e.m. for triplicate experiments. *P<0.05 (two-tailed, unpaired Student's t-test).

