Fig. 5.
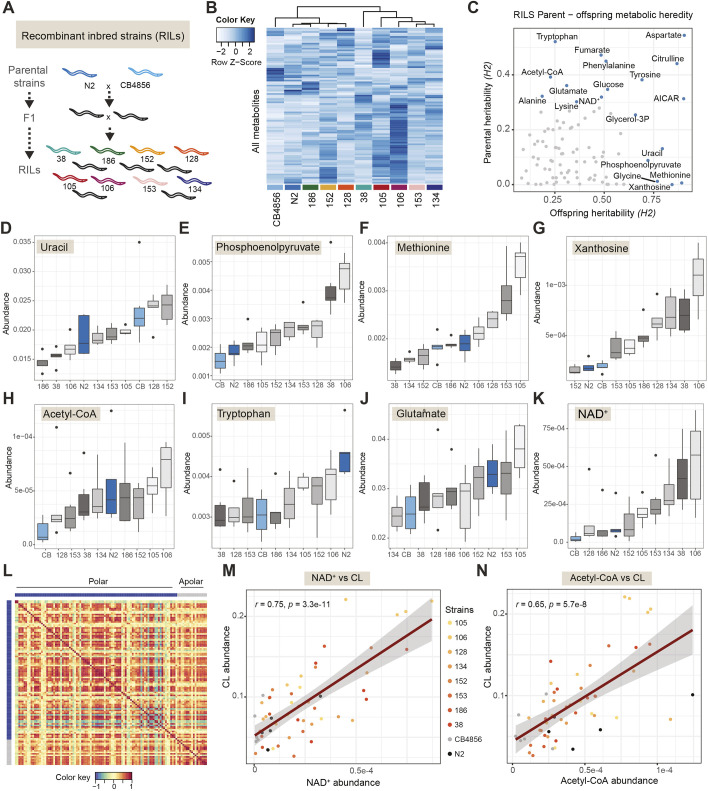
Natural diversity of metabolite abundances in recombinant inbred lines (RILs). (A) RIL strains selected for analysis. (B) Heatmap showing RILs and metabolites, showing diversity in metabolite levels present between the different strains (n=5-6). (C) Broad-sense heritability (H2) of offspring versus parental lines. Heritability indicates the percentage of variance for a given metabolite that is explained by genetics. Examples of diverse heritable outcomes include the following: (D) uracil (offspring H2 0.794, FDR<0.05; parental H2 0.131, FDR not significant); (E) phosphoenolpyruvate (offspring H2 0.721, FDR<0.05; parental H2 0.088, FDR not significant); (F) methionine (offspring H2 0.892, FDR<0.05; parental H2 0.006, FDR not significant); (G) xanthosine (offspring H2 0.843, FDR<0.05; parental H2 0.000, FDR not significant); (H) acetyl-CoA (offspring H2 0.228, FDR not significant; parental H2 0.392, FDR<0.05); (I) tryptophan (offspring H2 0.252, FDR not significant; parental H2 0.521, FDR<0.05); (J) glutamate (offspring H2 0.310, FDR not significant; parental H2 0.361, FDR<0.05); (K) NAD+ (offspring H2 0.486, FDR not significant; parental H2 0.319, FDR<0.05). (L) Cross-correlation matrix between polar (blue) metabolites and apolar (gray) lipid classes, highlighting the range of strong positive correlations (red) to strong negative correlations (blue) between all metabolites and lipid classes. (M) Example of correlation between apolar cardiolipins (CL) and polar NAD+ (Pearson's r=0.75, P=3.3×10⁻¹¹); parental lines and strains are color coded as highlighted in the key. (N) Example of apolar CL and polar acetyl-CoA (Pearson's r=0.65, P=5.7×10⁻⁸).

