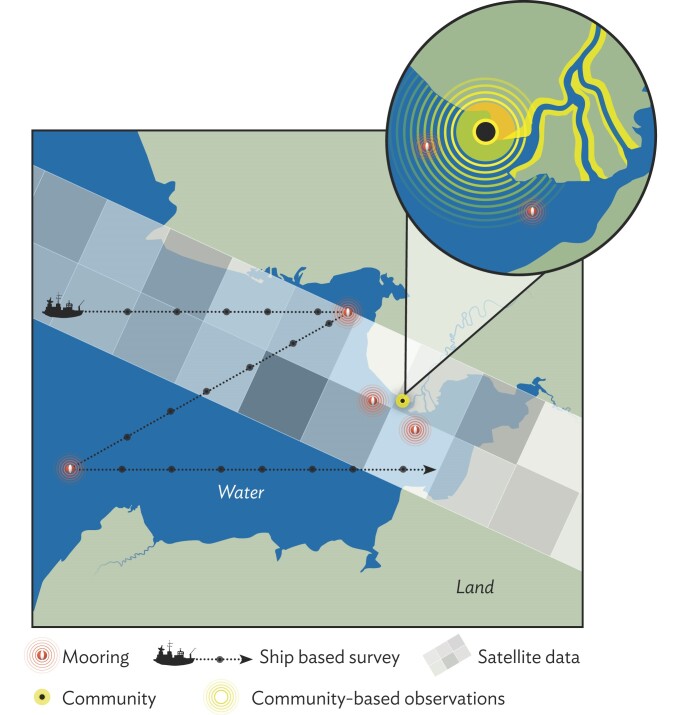
Figure 5.
Schematic illustrating the potential for mismatched observational scales in relation to areas of interest to community members—for example, for resource harvests (the yellow circles and corridors indicate the range over which such activities and associated observations extend, with greater distances covered along the river, including seasonal camps located further upstream).

