Figure 2.
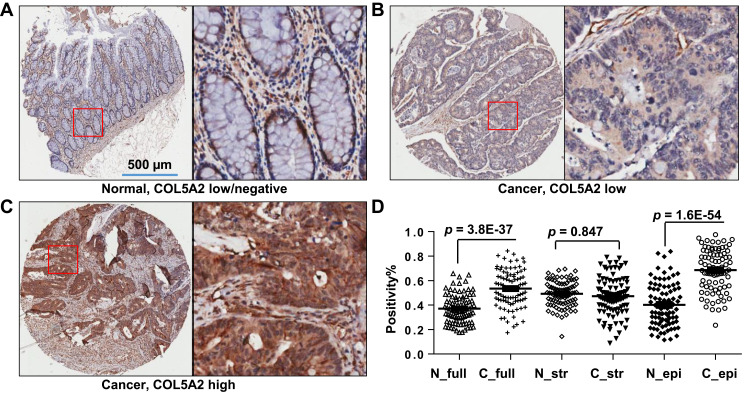
Expression of COL5A2 protein in colon cancer tissues. Immunohistochemistry (IHC) analysis was performed using two commercial tissue microarrays (TMAs) containing a total of 180 cases. (A) The image shows the negative or low expression of COL5A2 in normal colonic mucosa tissue. The bar represents 500 µm. The boxed area is enlarged to the right side. (B) Low and (C) high expression of COL5A2 in CRC tissue. (D) A statistic of COL5A2 expression between the normal and cancer tissues based on the scanned staining intensity values.
Abbreviations: N_full, normal tissue (full tissue spot on the TMA); C_full, cancer tissue (full tissue spot on the TMA); N_str, normal tissue, stromal part; C_str, cancer tissue, stromal part; N_epi, normal tissue, epithelial part; C_epi, cancer tissue, epithelial part.

