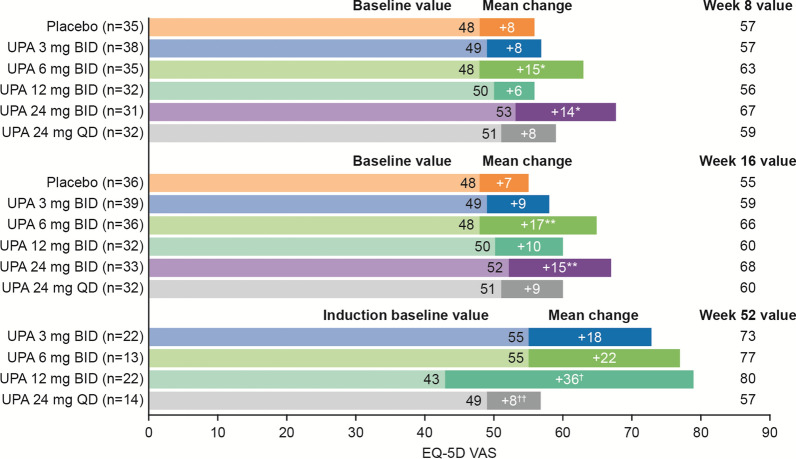
Fig. 3.
Change in EQ-5D VAS score with upadacitinib. *P ≤ 0.1 vs. placebo. **P ≤ 0.05 vs. placebo. †P ≤ 0.1 vs. UPA 3 mg BID. ††P ≤ 0.05 vs. UPA 3 mg BID. Change in EQ-5D VAS score for induction period used the mITT population and LOCF, and was analyzed using ANCOVA, adjusting for treatment, baseline disease severity, and baseline value. Change in EQ-5D VAS score for maintenance period used the ITT population and OC, and was analyzed using ANCOVA, adjusting for treatment and baseline value. ANCOVA analysis of covariance, BID twice daily, EQ-5D VAS European Quality of Life-5 Dimensions visual analog scale, ITT intent-to-treat, LOCF last observation carried forward, mITT modified intent-to-treat, OC observed cases, QD once daily, UPA upadacitinib

