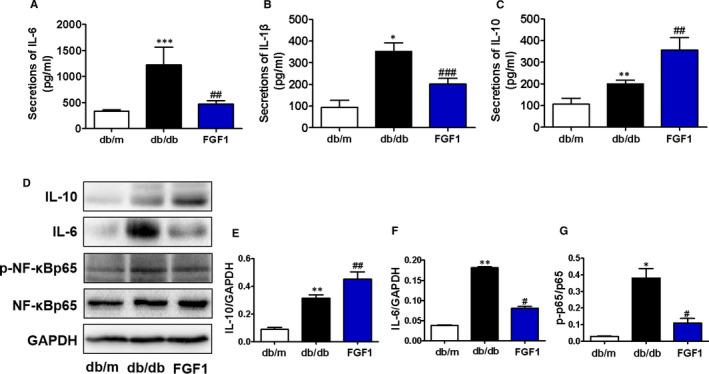
FIGURE 3.

FGF1 treatment ameliorates diabetes‐associated excessive inflammation in the liver. (A‐C) Plasma concentrations of pro‐inflammatory cytokines (IL‐6 and IL‐1β) and anti‐inflammatory cytokine (IL‐10) in db/m, db/db and db/db + FGF1 groups, n = 5. (D‐G) The Western blotting and quantitative analyses of IL‐10, IL‐6, p‐NF‐κBp65 and NF‐κBp65 expressions in the liver from different groups, n = 3. *P < .05, **P < .01, ***P < .001 vs db/m group; # P < .05, ## P < .01, ### P < .001 vs db/db group
