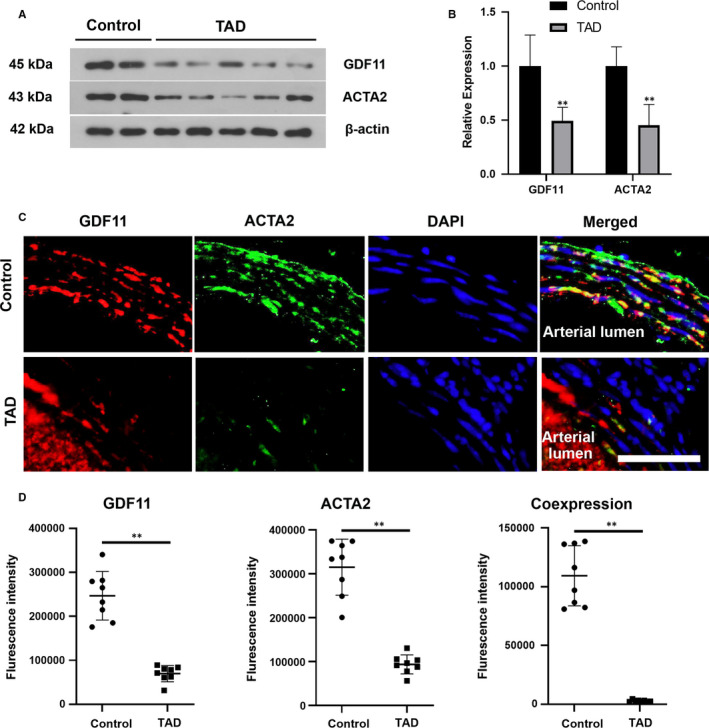
FIGURE 2.

Expression of GDF11 was significantly reduced in thoracic aortic tissues of TAD mice. (A) Protein blots of GDF11 and ACTA2 in thoracic aortic tissues. (B) Relative densitometry of protein levels. (C) Representative fluorescence microscopy images of for GDF11 (Red), ACTA2 (Green), and DAPI (Blue) in the thoracic aortic tissues of control and TAD mice. Scale bar, 50 μm. (D) Quantitation analysis of fluorescence intensity of GDF11 (Red), ACTA2 (Green) and co‐expression of GDF11 and ACTA2 (Yellow) from immunofluorescence. Data are presented as mean ± SD (n = 6‐8). **P < .01 vs control group
