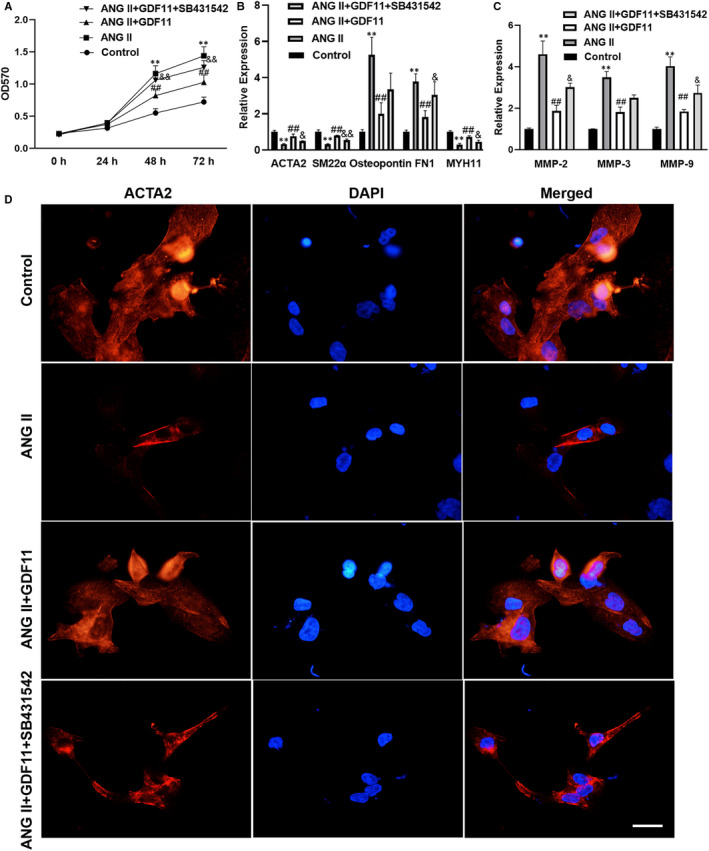
FIGURE 6.

Exogenous GDF11 suppressed Ang II‐induced synthetic switching of vascular SMCs. (A) MTT was used to detect the proliferation of SMCs. RT‐qPCR was performed to examine the phenotypic markers (B) and MMPs (C) in Ang II‐induced SMCs following GDF11 treatment. (D) Representative images of immunofluorescence staining for ACTA2 (Red) and DAPI (Blue) in the SMCs in different group. Scale bar = 33 μm. Data are presented as mean ± SD (n = 3). **P < .01 vs control group, ## P < .01 vs Ang II group, & P < .05 vs Ang II + GDF11 group, && P < .01 vs Ang II + GDF11 group
