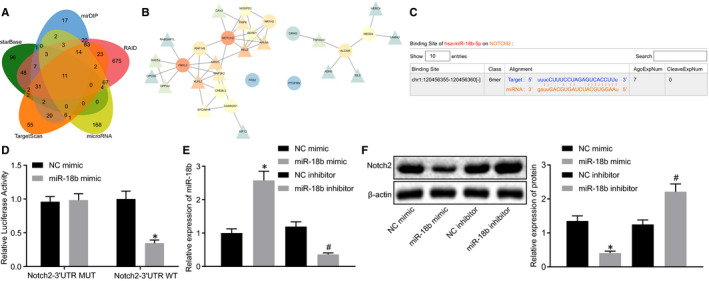
FIGURE 5.

miR‐18b could inversely target Notch2. A, The Venn plot of the downstream target genes of miR‐18b predicted by starBase, mirDIP, RAID, microRNA and TargetScan. B, A PPI network of intersection genes. The circle indicates that the gene is an input intersection gene, while the triangle indicates that the gene is a predicted related gene. The redder indicates higher core degree, which the bluer circle represents lower core degree. C, The predicted binding sites between miR‐18b and Notch2 predicted using starBase. D, The binding relationship of miR‐18b and Notch2 determined using dual‐luciferase reporter gene assay. E, The transfection efficiency of miR‐18b verified using RT‐qPCR. F, The protein level of Notch2 in the HTR‐8/SVneo cells determined using immunoblotting. *P < .05 vs the NC mimic group; #P < .05 vs the NC inhibitor group. The independent sample t test was conducted for the comparison of normally distributed data between two groups. Comparisons among multiple groups were conducted using one‐way ANOVA, followed by Turkey's post hoc test
