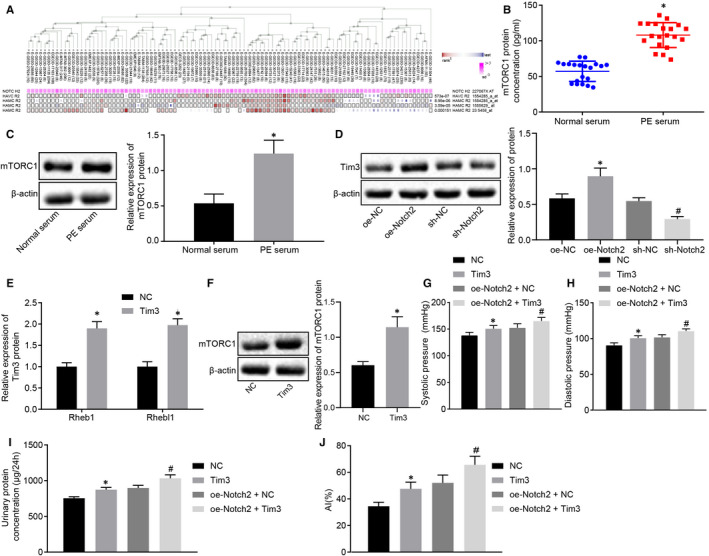
FIGURE 7.

Notch2 worsens PE by activating the TIM3/mTORC1 signalling pathway. A, The co‐expression relationship between Notch2 and TIM3 predicted using MEM (P = 2.73E − 07). B, The expression of mTORC1 in the PE serum group or normal serum group determined by ELISA (n = 20). C, The protein expression of mTORC1 in the PE patients or normal placental tissues determined by immunoblotting. D, The expression of TIM3 in rats determined by immunoblotting (n = 5/group). E, The expression of mTORC1 activating factor Rheb1 and its isomer Rhebl1 in rats determined using RT‐qPCR. F, mTORC1 expression normalized to β‐actin in rats determined by Western blot analysis. G, The systolic blood pressure of rats. H, The diastolic blood pressure of rats. I, The 24‐h urinary protein concentration of rats. J, The cell apoptotic rate in placental tissues determined using TUNEL (×400). *P < .05 vs the normal serum, normal placental tissues, NC, oe‐NC groups; #P < .05 vs the sh‐NC or oe‐Notch2 + NC groups. The independent sample t test was conducted for the comparison of normally distributed data between two groups. Comparisons among multiple groups were conducted using one‐way ANOVA, followed by Turkey's post hoc test. Variables were analysed at different time points using Bonferroni‐corrected repeated measures ANOVA
