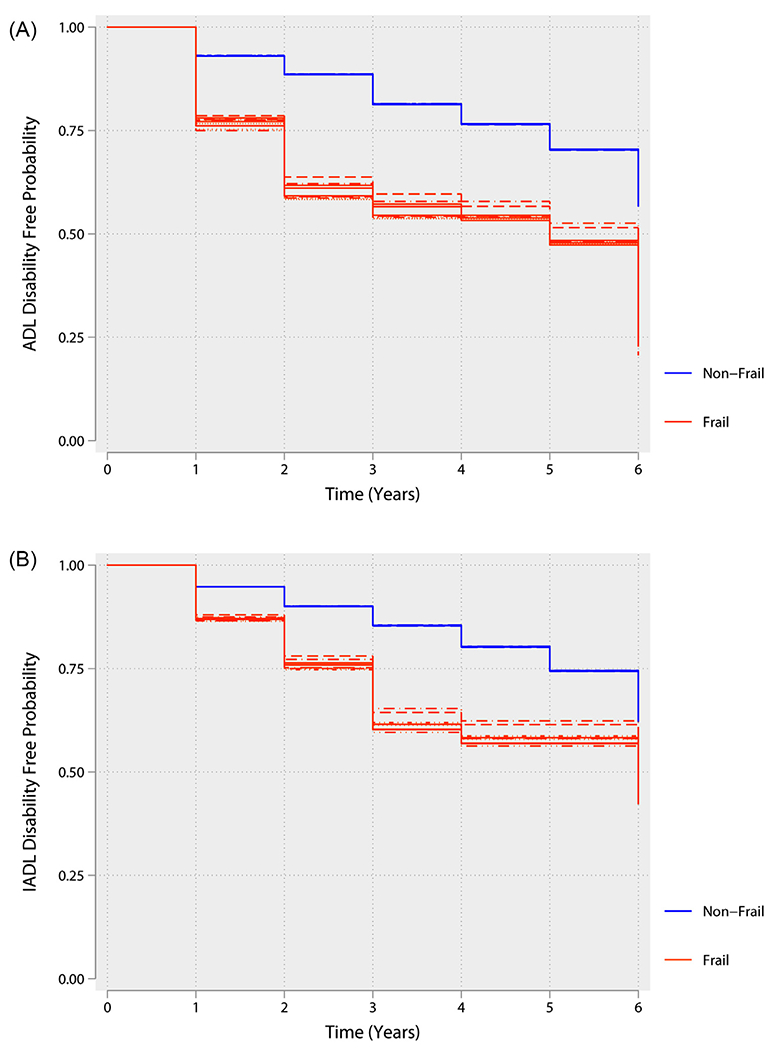
Figure 2.

(A) Kaplan-Meier curve illustrating the association between baseline physical frailty phenotype and activity of daily living (ADL) disability. The lines of the same color represent the variability in the estimates because of the uncertainty in frailty status results from multiple imputation of missing data. (B) Kaplan-Meier curve illustrating the association between baseline physical frailty phenotype and instrumental activities of daily living disability. The lines of the same color represent the variability in the estimates because of the uncertainty in frailty status results from multiple imputation of missing data.
