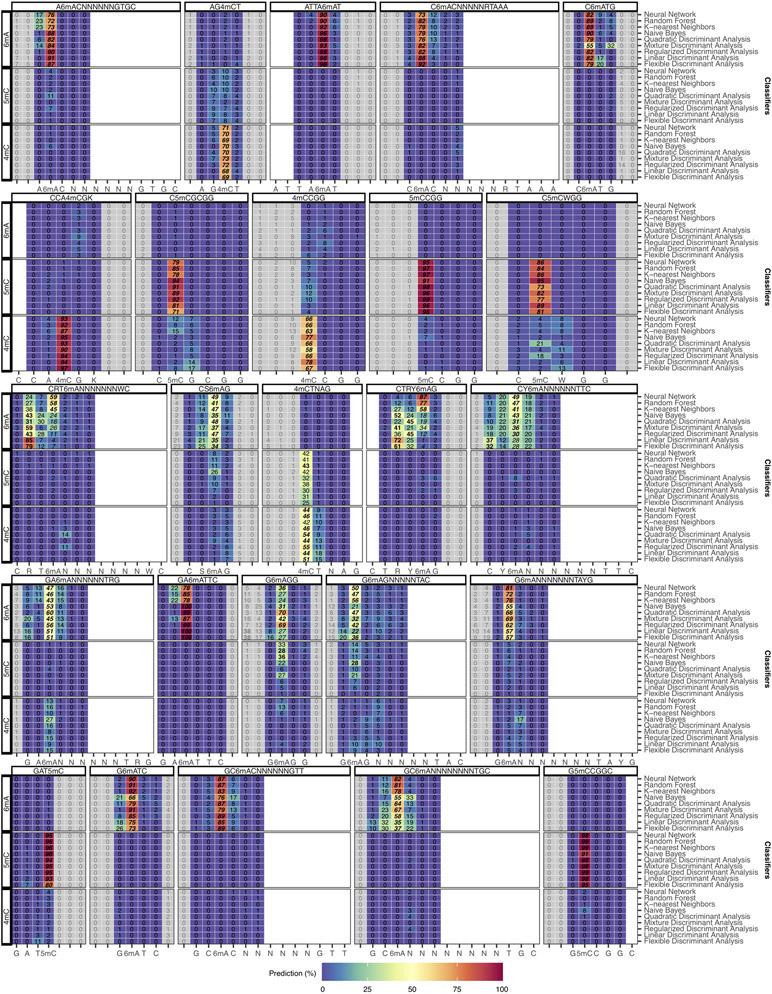
Extended Data Fig. 5. Classification and fine mapping of three types of DNA methylation (part 1).
Similar to Fig. 4d with full set of prediction results for a subset of methylation motifs for k-nearest neighbors, random forest, and neural network. Filling colors correspond to percentage of occurrences classified to a specific class ranging from blue (0%) to red (100%). Greyed out prediction correspond to out of motif position. Blank columns correspond to within-motif positions without prediction. Prediction percentages of expected classes are displayed in italic and selected predictions based on consensus are displayed in bold.

