Figure 5:
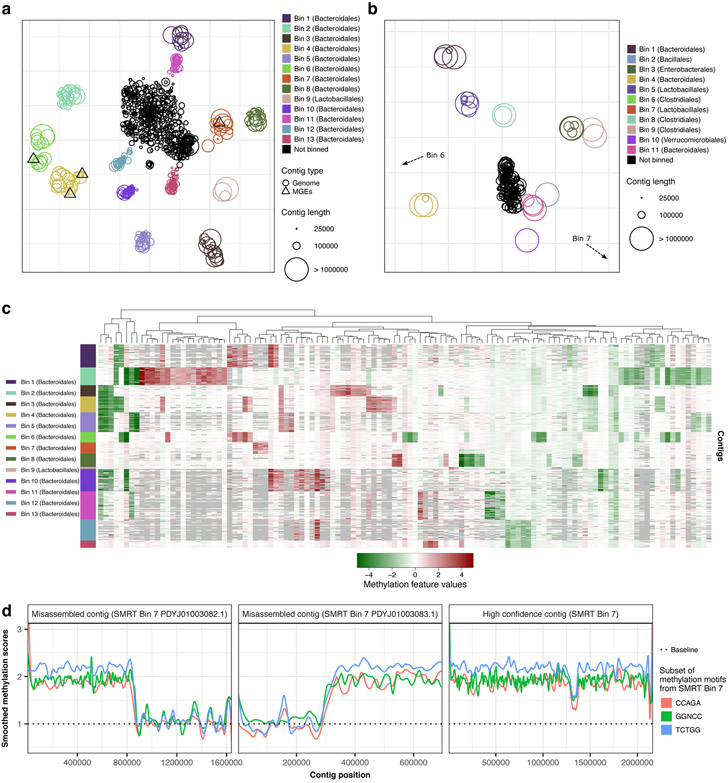
Methylation analysis of mouse gut microbiome samples. (a) Methylation binning of MGM1 contigs using de novo discovered motifs (after three rounds of binning followed by motif discovery; Methods, Extended Data Figs. 8, 9). Methylation features computed from de novo discovered motifs with t-SNE analysis. Contigs are colored based on bin identities with point sizes matching contig length. (b) Same as a but for MGM2 contigs (one round of binning followed by motif discovery; Methods, Extended Data Figs. 8, 10). Non-zoomed plot (with visible Bins 6, 7) in Extended Data Fig. 10b. (c) Heatmap of methylation feature values (all de novo discovered motifs) across binned contig from MGM1 sample (n=309 contigs). Only the significant features with absolute values above 1.5 pA in the bin of origin (where the motif was discovered) were selected (n=119 methylation features). Missing methylation features from contigs (less than 5 motif occurrences) are colored in grey. (d) Detection of misassemblies using methylation signal along contigs. Left and middle panels: misassembled contigs mislabeled as Bin 7 in SMRT analysis (PDYJ01003082.1 and PDYJ01003083.1, contigs marked with an asterisk in Supplementary Fig. 3a. Right panel: an example of a properly assembled contig from SMRT Bin 7 (PDYJ01000763.1). We selected three de novo detected motifs from SMRT Bin 7 and scored their methylation sites along the three contigs. Methylation scores were smoothed and displayed with one color per motif. Methylation scores are consistent in the contig in the right panel, but not in the misassembled contigs. A switch of methylome occurs near 800 kbp and 300 kbp in the left two panels respectively, supporting misassemblies (detailed in Supplementary Fig. 4a,b).

