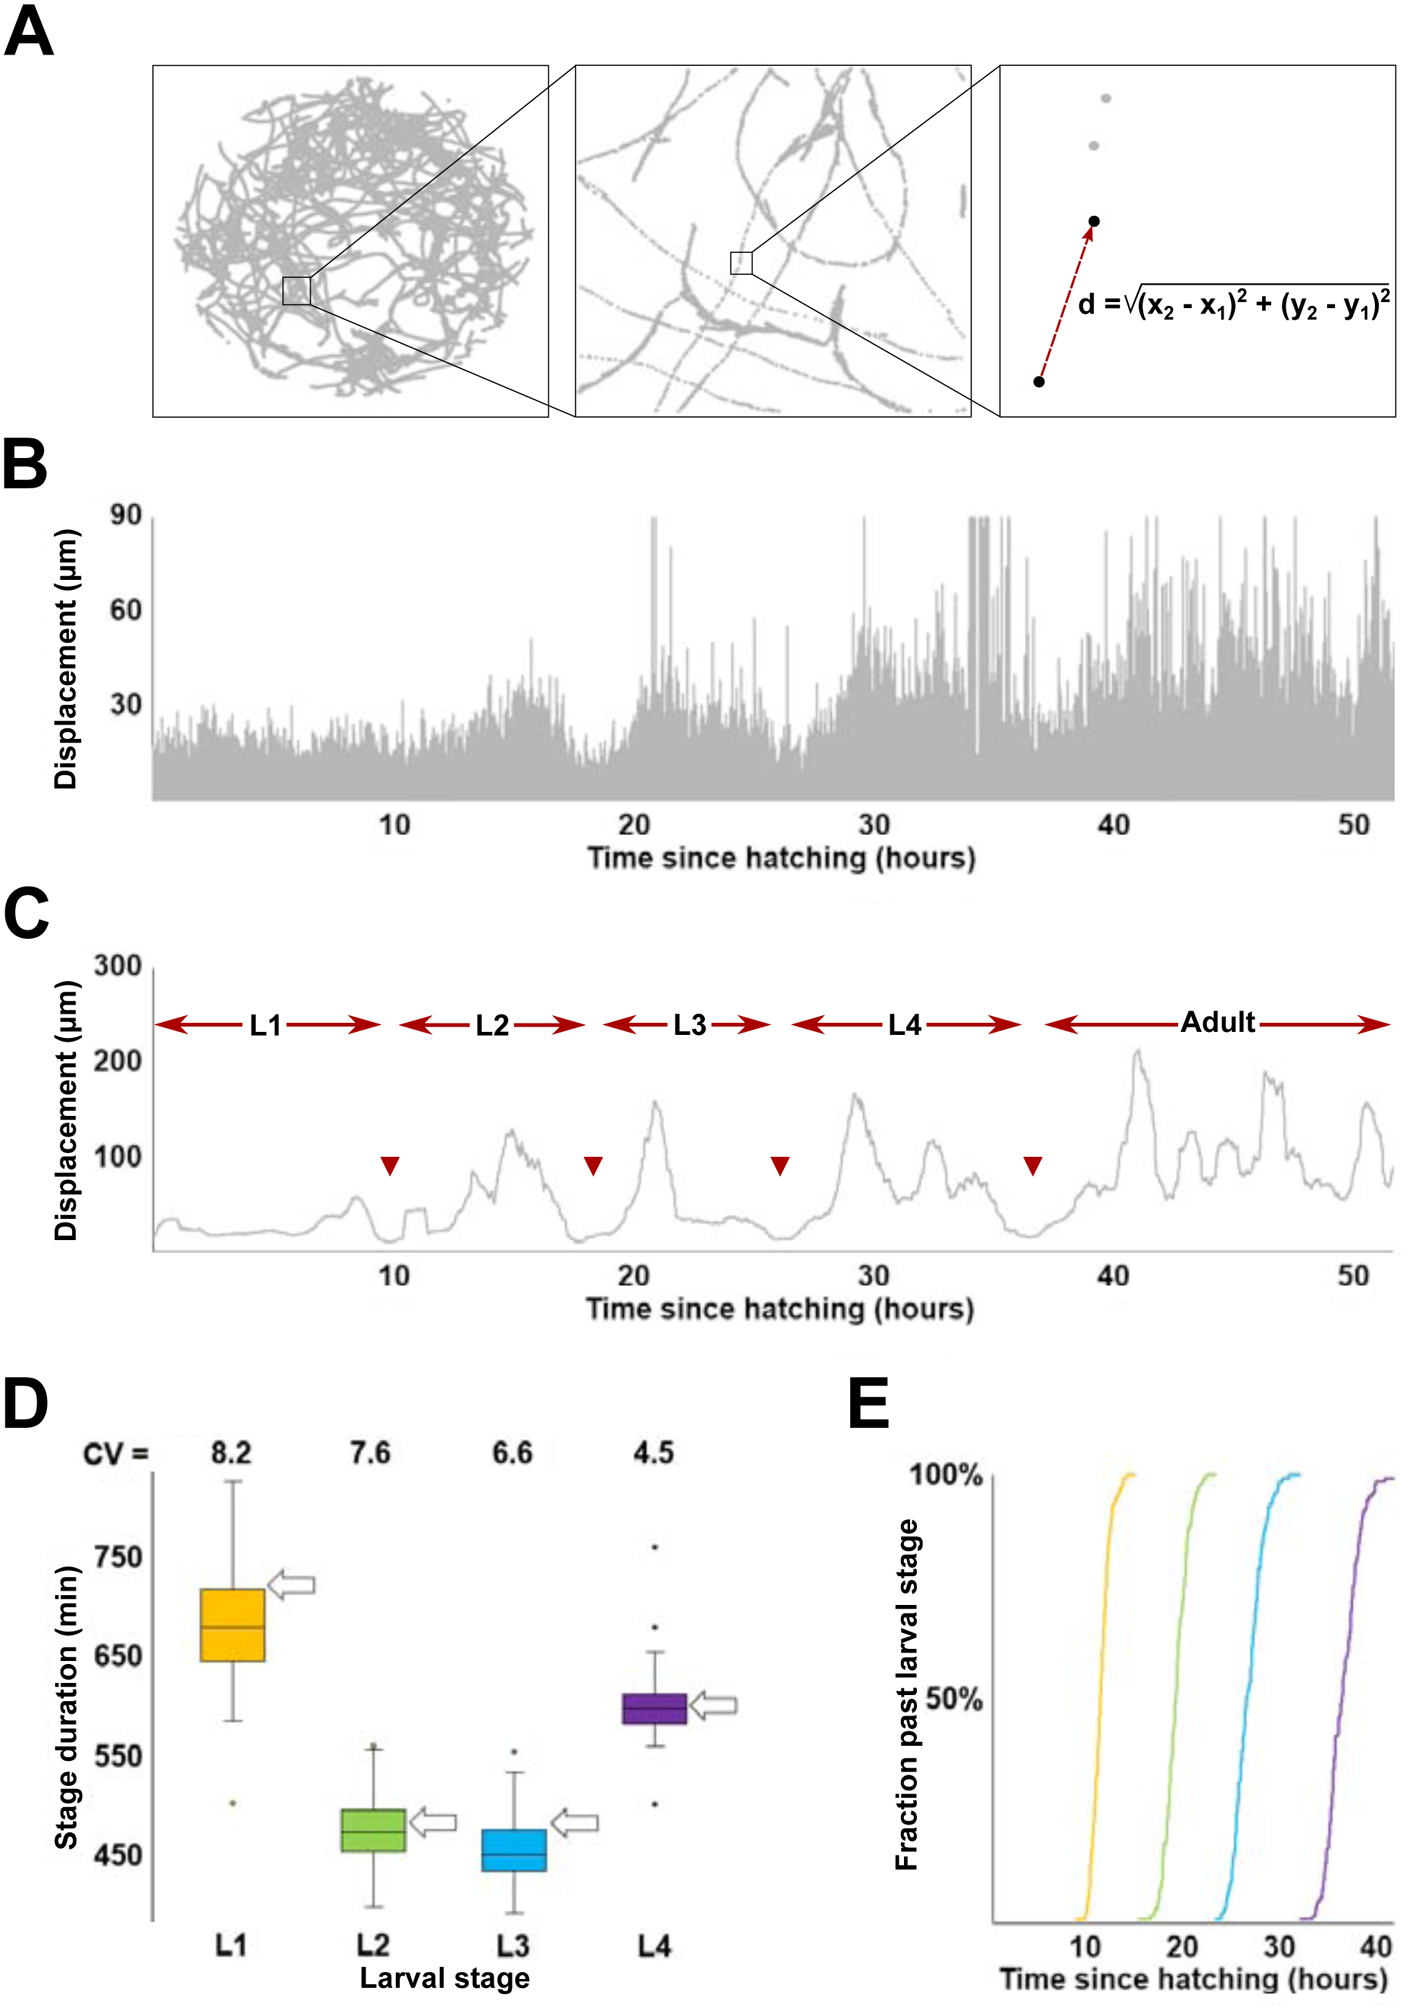
Figure 1. Inferring duration of larval stages from high-content behavioral tracking data.

(A) Track of a single C. elegans hermaphrodite over the course of an ~50 hour recording. The right-most box shows calculation of displacement as distance between centers of mass of the tracked worm between two sequential frames. (B) Activity profile (i.e., plot of all consecutive displacements) of the worm shown in (A). Note that due to fluctuations in locomotor behavior, the ~600,000 displacements shown here exaggerate local extremes – vast majority of displacement values are considerably lower (mean ~4–5 μm) than the outline. See Figure S1 for more detail. (C) Activity profile of the worm shown in (A) produced from displacement values sampled at 0.1 Hz and smoothened (55.5 min). Arrowheads indicate boundaries between larval stages defined as mid-points of periods of reduced activity. (D) Inferred durations and coefficients of variation (CV; expressed as %) of L1-L4 larval stages. Arrows indicate stage durations (at 22°C; recordings analyzed in this study were collected at the same temperature) as shown in (https://www.wormatlas.org/hermaphrodite/introduction/Introframeset.html). (E) Transition times (sample N=125) between (L1, L2, L3, L4) larval stages.
