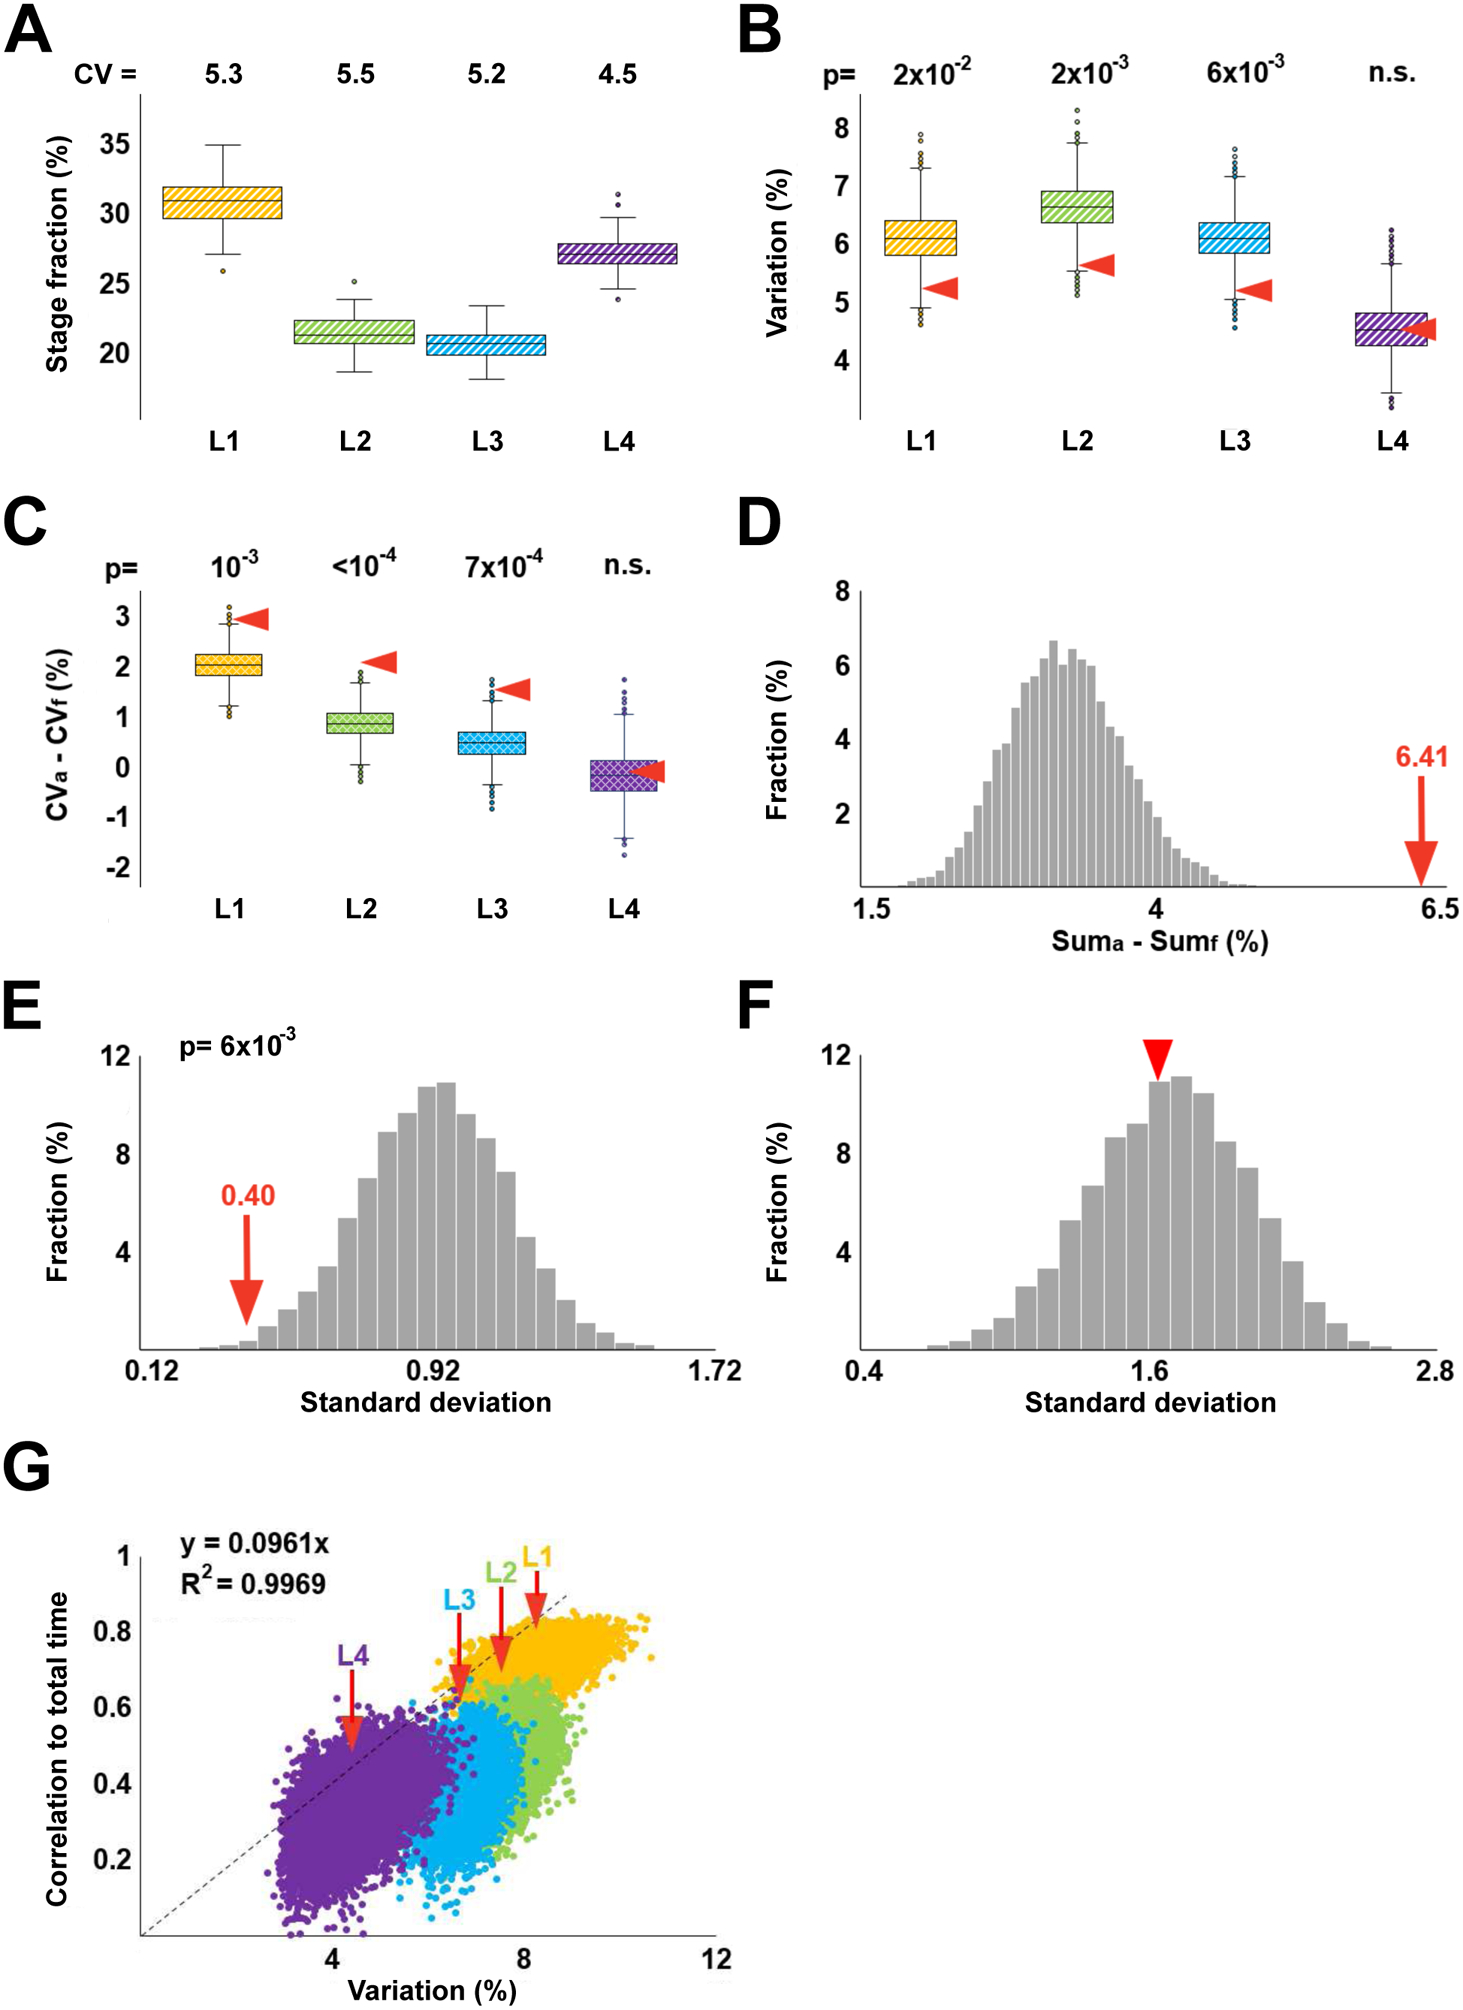
Figure 4. Fractional scaling of developmental time.

(A) Fractional durations of larval stages calculated based on data in Figure 1D. Shown above are CVs (expressed as %) of L1-L4 stages. (B) Coefficients of variation of fractional stage durations from 10,000 randomly permuted sets. Arrowheads denote coefficients of variation of the empirical stage durations. (C) For each of the 10,000 randomly permuted sets, the CV of fractional durations (CVf) of a given stage was subtracted from the CV of absolute duration (CVa) of this stage; distributions of resulting values are represented as boxplots. Red arrowheads indicate CVa-CVf for the empirical data set. (D) The histogram in grey shows the following values for each of the 10,000 randomly permuted sets: (CVaL1 + CVaL2 + CVaL3 + CVaL4) − (CVfL1 + CVfL2 + CVfL3 + CVfL4). Red arrow indicates the same quantity obtained for the empirical data set. (E) Distribution of standard deviations of CVs of fractional stage durations from 10,000 randomly permuted data sets. p-value shows that only 58 of 10,000 values from permuted data are lower than the CV of fractional stage durations from the empirical dataset (red arrow). (F) Distribution of standard deviations of CVs of absolute stage durations from 10,000 randomly permuted data sets. Red arrowhead marks CV from the empirical dataset. (G) Pairs of ci, si values from each of 10,000 randomly permuted data sets compared to values of the empirical data set (indicated by red arrows). The four larval stages are depicted in different colors. The dashed line, the equation that describes it, and the R2 value are to demonstrate that si ≈ 10ci. In panels B, C, and E, p-values are the fractions of instances (out of 10,000) in which randomly permuted data were more extreme than those from the empirical dataset. In panel D, no value was as high as 6.41, indicating a conservatively estimated p < 10−4.
