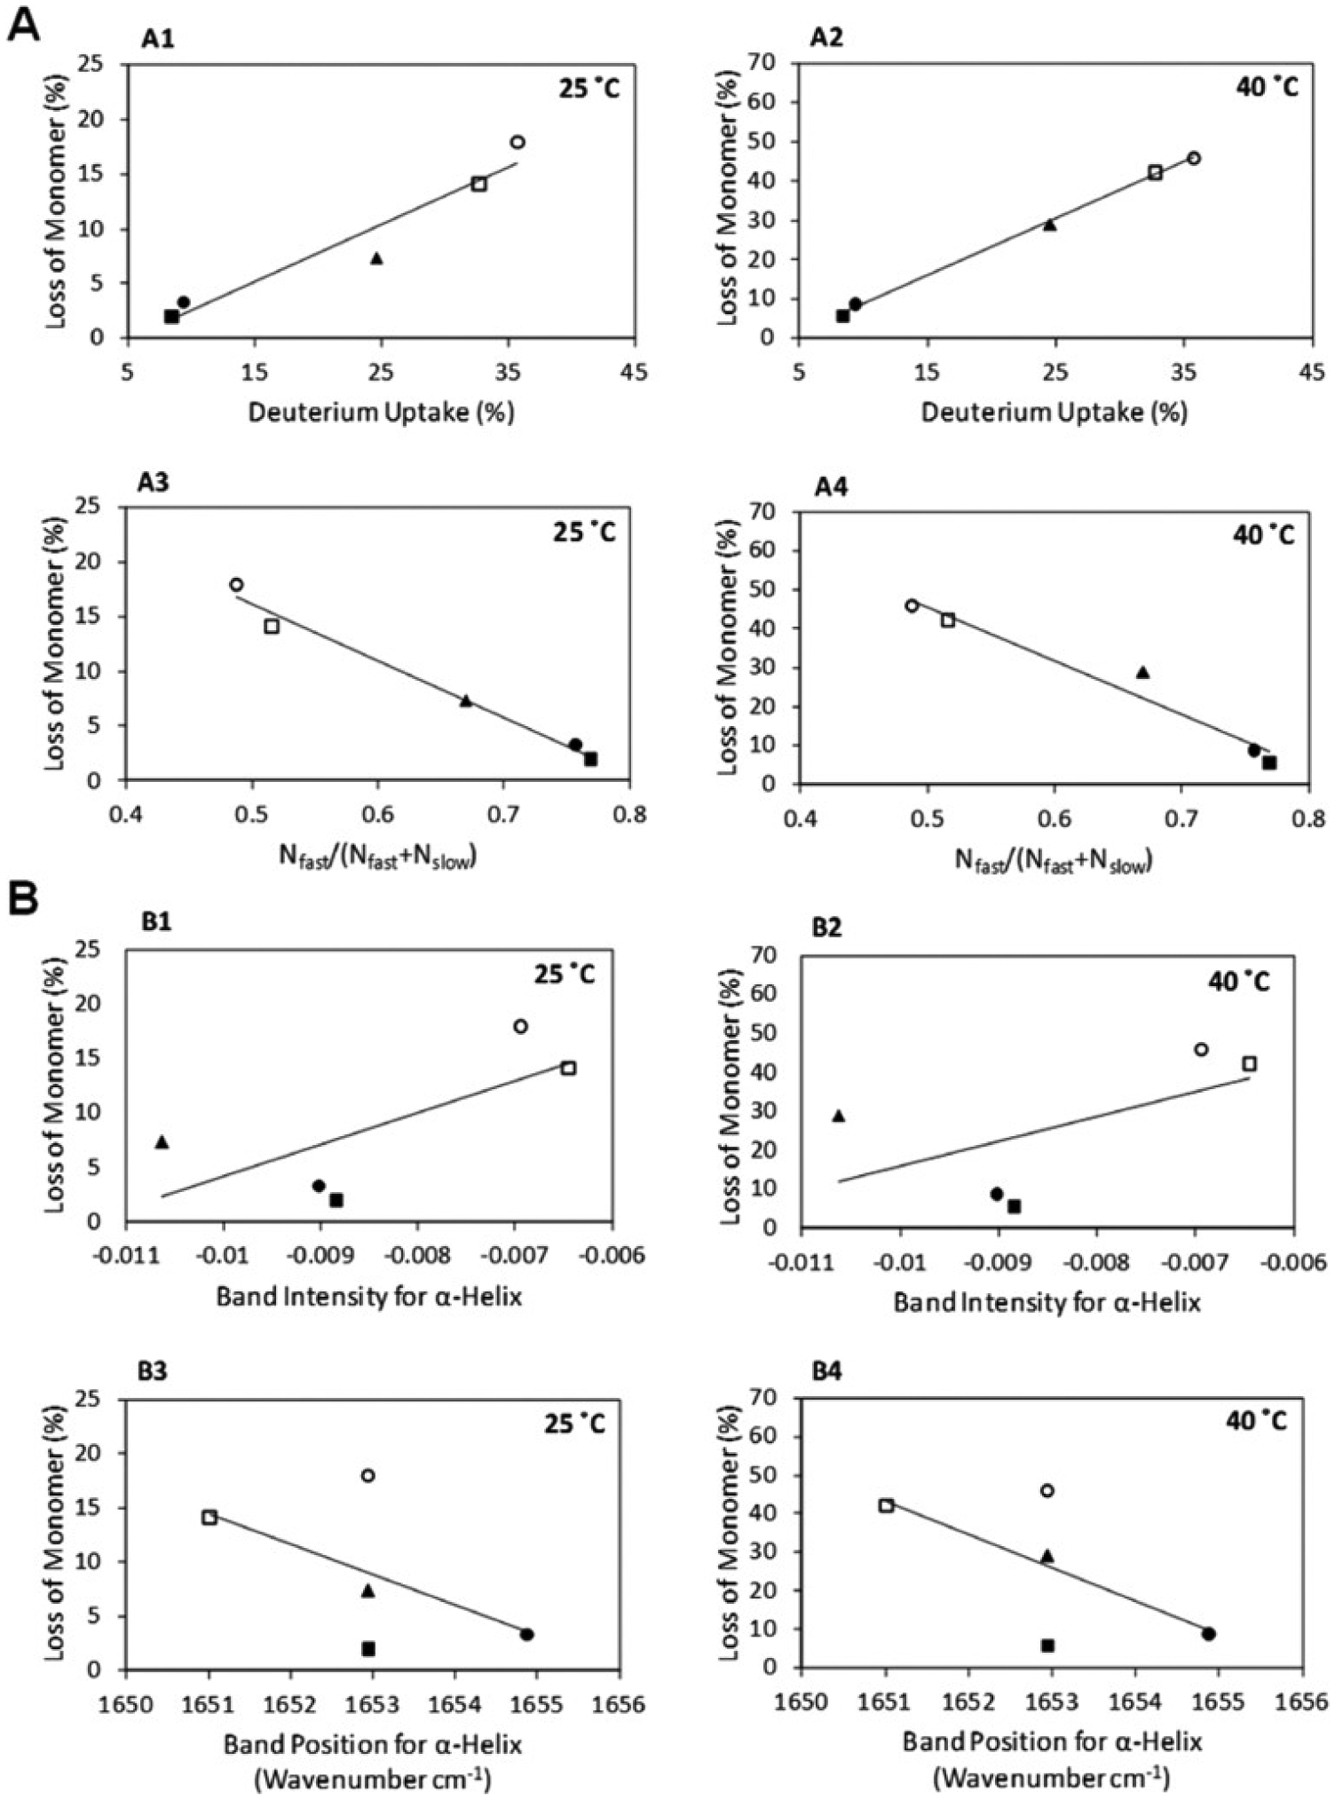
Figure 4.

Correlation of Mb aggregation during long-term storage (at t = 360 days) with t = 0 ssHDX-MS (A) and FTIR (B) analysis. The percent loss of Mb monomer after 360 days of storage at 25 and 40 °C as a function of percent deuterium uptake (A1 and A2), Nfast/(Nfast + Nslow) (A3 and A4), band intensity for α-helix (B1 and B2), and band position for α-helix (B3 and B4) in formulations, MbA (closed circle), MbB (closed triangle), MbC (open circle), MbD (open square), and MbE (closed square) (n = 3, ± SE). Reprint from [245] with permission from ACS. Further permissions related to the material excerpted should be directed to the ACS.
