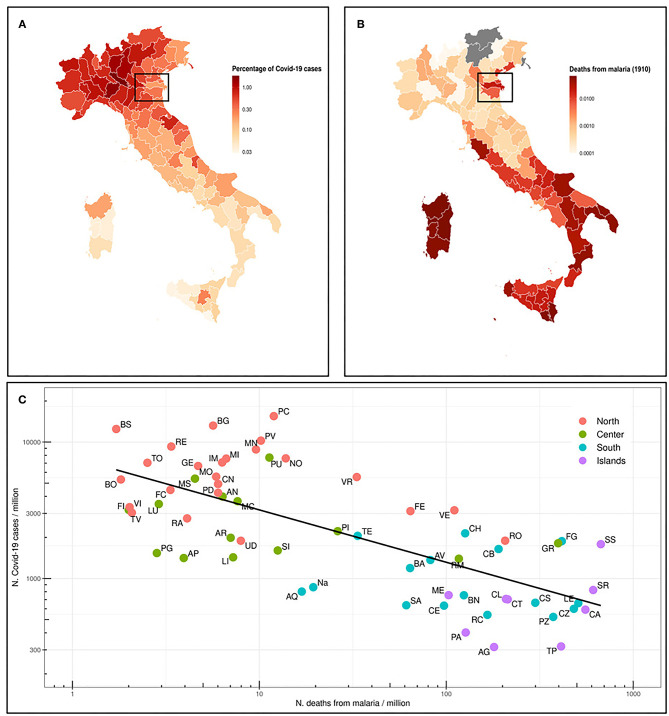
Figure 1.
(A) Map of the Italian provinces and representation as colorimetric scale of the percentage of deaths for malaria in 1910 (data not available for those provinces that were not included in the Italian Kingdom). The box highlights Ferrara and Rovigo provinces. (B) Map of the Italian provinces and the relative percentage of COVID-19 cases as n. COVID-19 cases/106 inhabitants in the province (situation on July 13th, 2020). (C) Prevalence of COVID-19 cases (n. cases/106 inhabitants) in Italian provinces (July 13th, 2020) vs. number of deaths from malaria in 1910. The regression line of log10 transformed values is shown. Spearman ρ = −0.69 and p-value 5.4e-10.

