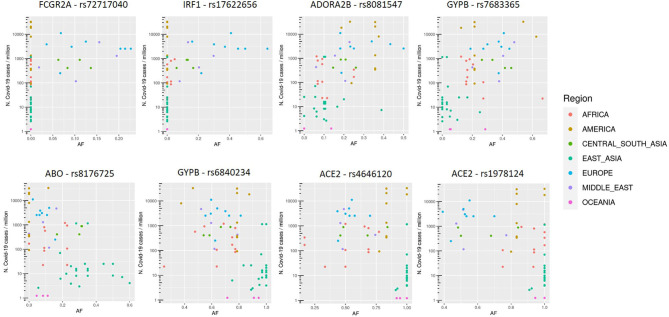
Figure 2.
Allele frequency (AF) distribution in each population of selected variants, named with the rs number and gene symbol, in relation to the COVID-19 prevalence (n. COVID-19 cases/106 inhabitants). Each dot is a population and colors are associated to specific geographic area, as reported in the legend.

