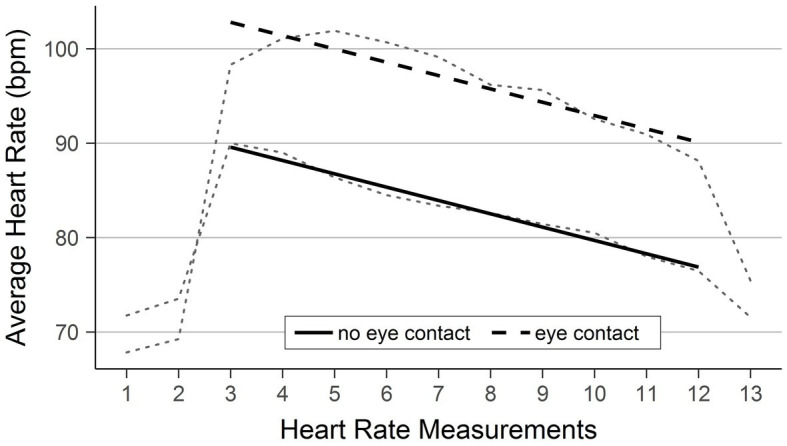
Figure 2.

Fitted regression lines of heart rate in the two conditions over time. The figure shows the heart rate predicted by the regression. The bold, solid line shows the prediction for the no eye contact condition and the bold, dashed line shows the prediction for the eye contact condition. The model includes all measurements taken during the reading of insults (three through 12). The light, dotted lines in the background show the observed development of the average heart rates (cf. Figure 1).
