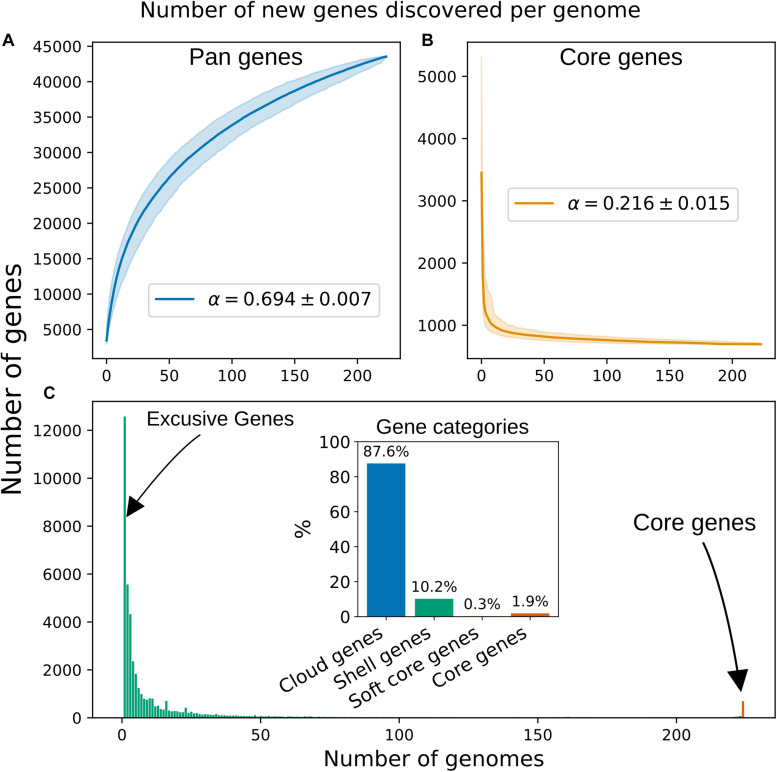
FIGURE 2.
Rarefaction curves for “pan” (A) and “core” (B) genes. The curves were fitted to median values of 1,000 iterations following the Power Law previously described (Tettelin et al., 2008). The Shadows indicate 95% confidence intervals. (C) Distribution of the 43545 pan genes among the 224 genomes of the Blautia dataset. The bar representing the core genes is highlighted with red color. Inset: Percentages for each gene category in the pangenome, see Table 2 for definitions.

