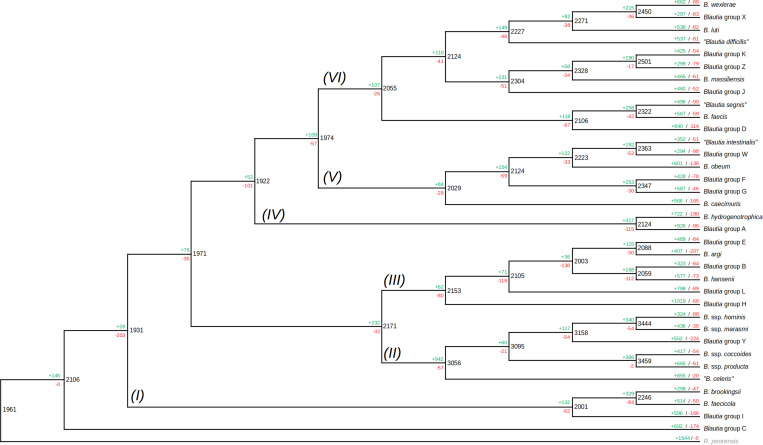
FIGURE 4.
Gain/loss profile among different ancestors and lineages among the representative set of Blautia genomic species. The same tree (with the same members) shown in Figure 1, was presented as a cladogram, and the data from Count analysis of gene gain/loss models, following Wagner parsimony model for 12,691 gene families, was represented. The roman numbers near each branch represent each proposed lineage among the members. Black numbers represent the number of shared families for a given node (i.e., predicted ancestor), as well as the green and red numbers represent the number of gene families gained and lost for the ancestor. The green and red numbers on the upper side of each terminal branch represented the same terms as before, but for the members of the tree (the terminal nodes). See text for more details.

