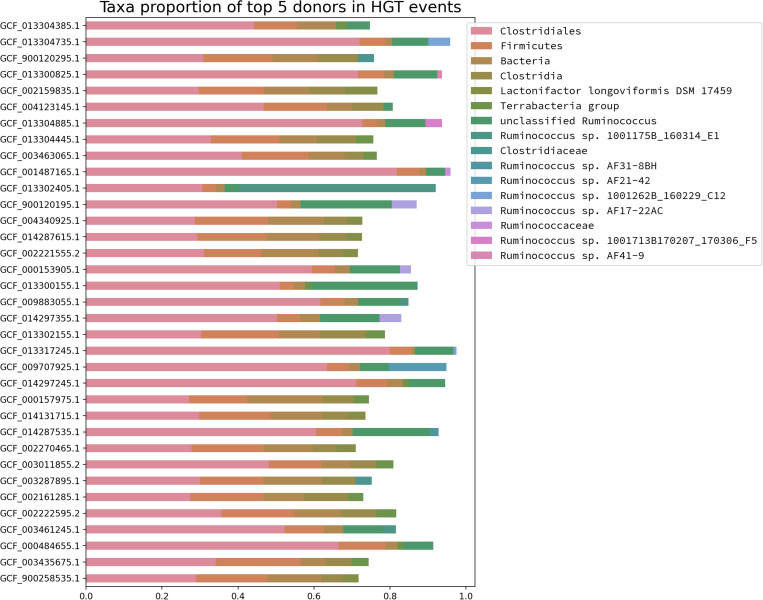
FIGURE 5.
Taxonomic abundance profile of the top five HGT donors for the Blautia genomes from the representative dataset. Each genome was analyzed by HGTector and the frequency of taxonomic assignments for the top 5 putative donors were plotted for each case. The color code corresponds to the donors listed in the legend (upper right side).

