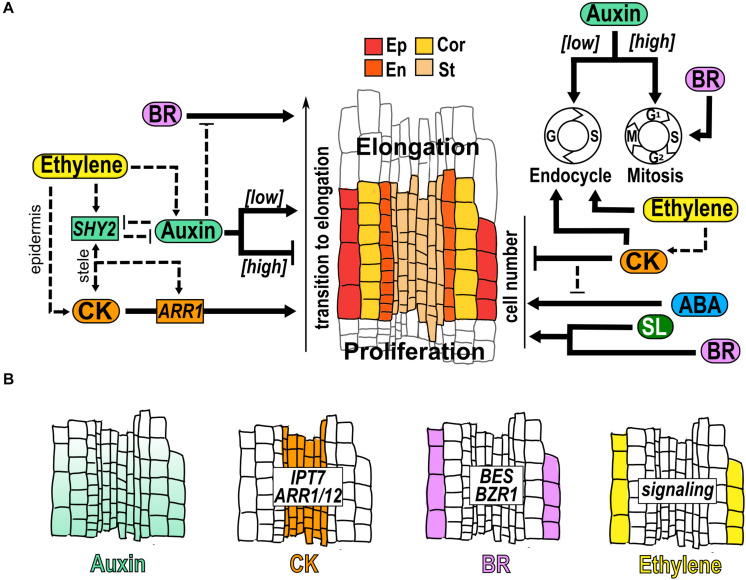
FIGURE 3.
Hormone function in the transition domain. (A) Structure of the TD that is a region flanked by the dividing cells of the PD and the elongating cells in the EZ. The cells of different tissues are indicated: epidermis (Ep), cortex (Cor), endodermis (En) and stele (St); and hormonal regulation (black arrows) and crosstalk (dotted arrows) over the control of the transition to elongation, the TD cell number and the control of endocycle, conformed by Gap (G) and Synthesis (S); and Mitosis (M), conformed by Gap1 (G1), S, Gap2 (G2) and M is indicated. (B) Hormone accumulation (different colors), expression pattern of genes and hormonal pathways that participate in the TD.

