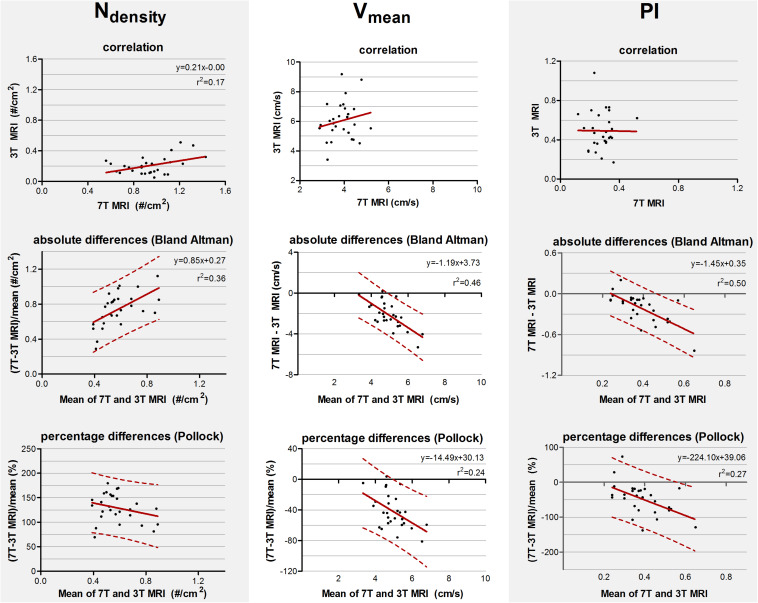
FIGURE 3.
Top row: Correlation plots of the number of detected perforating arteries/cm2 (Ndensity), the mean blood flow velocity (Vmean) and pulsatility (PI) measured at 3 tesla (T) and 7T MRI. The line resulting from linear regression is given by the solid line. In case of a significant correlation the equation of the regression line is given. Middle and bottom row: difference plots in absolute units (Bland Altman) and in percentage units (Pollock), respectively, for Ndensity, Vmean, and PI. The regression line (i.e., bias) (solid line) and the limits of agreement (dotted lines) are shown. In case of a significant linear regression, the equation of the regression line is presented.

