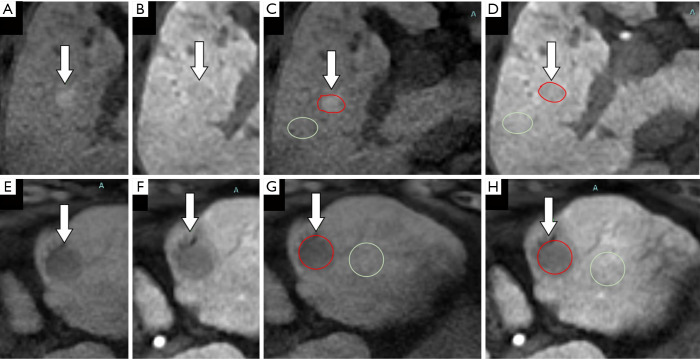
Figure 2.
Schematic diagram of the quantitative measurement methods for the pre-contrast ratio, post-contrast ratio, and gadolinium-ethoxybenzyl-diethylenetriamine pentaacetic acid (EOB) enhancement ratios. (A,B,C,D) and (E,F) are 2 different cases with characteristics of small size and unclear margin, respectively. Images (A,C,E,G) show the unenhanced T1-weighted images, while (B,D,F,H) show hepatobiliary phase (HBP) images. In (C,D,G,H), the regions of interest of our target lesions are marked in red, and the surrounding non-tumorous regions which were used as a reference are marked in green. In principle, the priority of reference should be given to uniform liver parenchyma without blood vessels with a similar size to the target lesions. (C,G) show unenhanced T1-weighted images, pre-contrast ratio = signal intensity of lesion (red area)/signal intensity of non-tumorous regions (green area). (D,H) show HBP images, post-contrast ratio = signal intensity of lesion (red area)/signal intensity of non-tumorous regions in the HBP image (green area). The EOB enhancement ratio = post-contrast ratio/pre-contrast ratio. The arrows indicate the target lesion.

