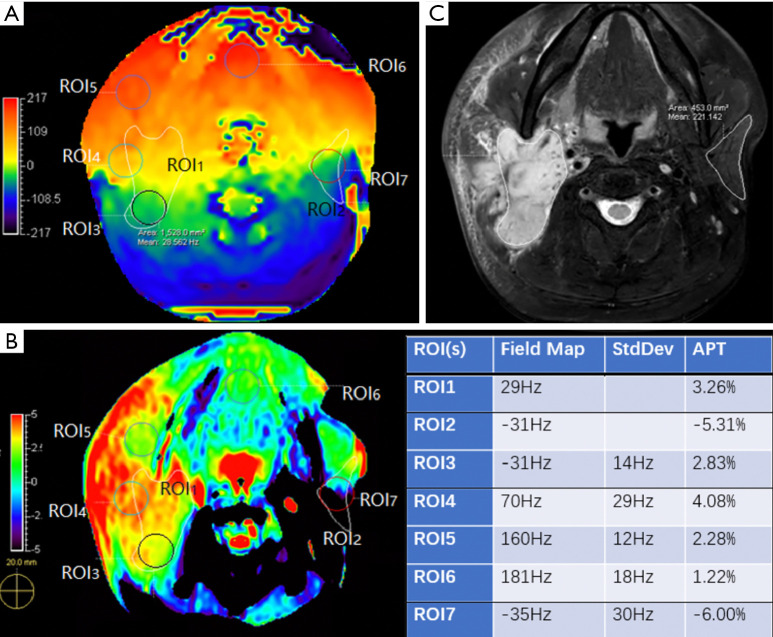
Figure 6.
An example of the B0 map image (A) and APT image (B) on the parotid lesion and gland. A diffused lesion was found in the right parotid gland of a 47-year-old male, as shown on T2WI (C). On APTw image (B), the integrity score of the right parotid lesion (ROI1, score =4) was higher than that of the left normal parotid gland (ROI2, score =1). Scores regarding the hyperintensity for the right parotid lesion and the left normal gland were 2 and 4, respectively. The parts with a higher standard deviation (StdDev) value (ROI4 and ROI7) on the B0 map image had more APT artifacts (even hidden) compared to the ROI with a low StdDev value (ROI5 and ROI6), though the mean value in the B0 was lower, indicating that a larger fluctuation in the B0 could be the key source of hyperintensity artifacts on APTw maps.

