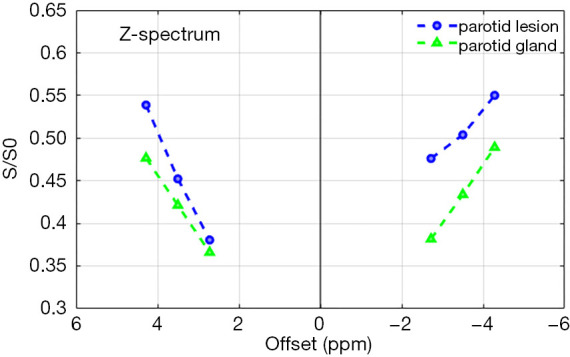
Figure 9.

Measured z-spectrums at ±2.7 ppm, ±3.5 ppm, and ±4.3 ppm (relative to water protons) normalized to signal S0 with far offset (−1,560 ppm) saturation. The green curve and blue curves are the z-spectrum acquired from a parotid gland and a parotid lesion, respectively. The decreased signal from the parotid lesion at 3.5 ppm side corresponds to amide-water proton exchange.
