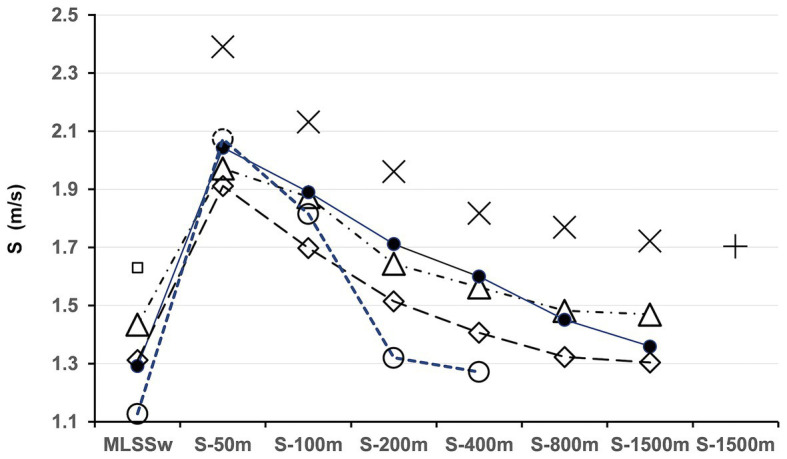
Figure 5.

Comparison of swimming performance in relation to maximal lactate steady state workload (MLSSW) across Olympic distances. ▲ = Test person (TP) 1, ● = TP 2, ◊ = TP3, ○ = TP4, □ = estimated MLSSW Australian National Team 1996, according to Pyne et al. (2001), + = world record 1994 (Kieren Perkins, Australia), X = current world records (FINA, F.I.d.N., 2021). TP1 had the highest MLSSW, resulting in comparatively good results across all distances. TP4 was slightly faster at 50 m, but slowed down rapidly at longer distances. Note that TP2 performed close to the MLSSW in the 1,500 m race (∆ S-Comp/MLSSW = −0.008 m/s). ∆S-Comp/MLSSW for TP1/TP3 was moderate (0.035/0.067 m/s) with a relatively high MLSSW for TP1 and a relatively low MLSSW for TP3 (1.434/1.387 m/s; for a detailed analysis see section “Discussion”). Since MLSSW data from world record holders were not available, we estimated the values using data from Pyne et al. (2001). Although these calculations are certainly not entirely accurate, they clearly demonstrate the large gap between MLSSW1996 and the 1,500 m world record in 1994. S, speed.
