Figure 1.
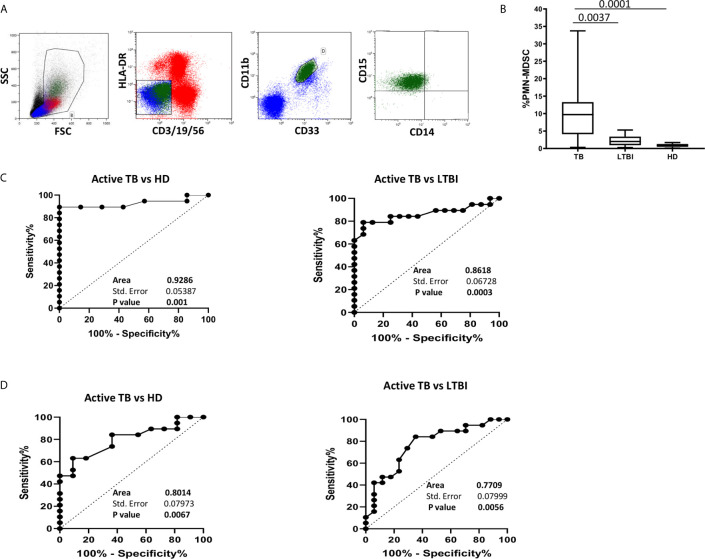
PMN-MDSC discriminate active TB and LTBI. (A) Gating strategy used to identify MDSC: in the morphological gate (FSC/SSC) we excluded debris, then we gated Lin-/HLA DRlow/- cells. In this gate, we selected CD11b+CD33+ cells (MDSC). Then, the expression of CD14, CD15 is shown. The percentage of Lin-/HLA-DR-/CD11b+/CD33+ has been calculated in the morphological gate. (B) PMN-MDSC frequency in active TB (18), LTBI (19) and HD (12). Results are shown as Box and Whiskers. The Kruskall-Wallis test (with Dunn’s multiple comparison posttest) was applied. (C) Receiver operating characteristic (ROC) curve for the PMN-MDSC frequency. Right panel TB vs HD, left panel TB vs LTBI. (D) Receiver operating characteristic (ROC) curve for the Mo/Ly ratio. Right panel TB vs HD, left panel TB vs LTBI. PMN-MDSC: polymorphonuclear-myeloid-derived suppressor cells; TB, tuberculosis; LTBI, latent tuberculosis infection; HD, healthy donors.

