Figure 3.

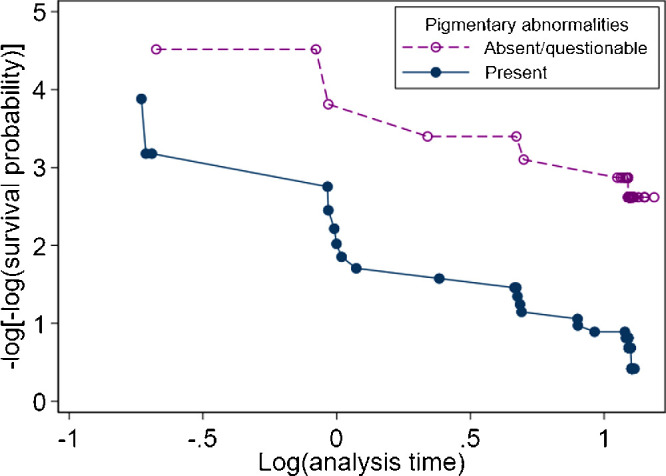
Graphical assessment (log-log plots) of the proportional-hazards assumption for pigmentary abnormality status when investigating time to late age-related macular degeneration among the sham treatment group from the LEAD study.

Graphical assessment (log-log plots) of the proportional-hazards assumption for pigmentary abnormality status when investigating time to late age-related macular degeneration among the sham treatment group from the LEAD study.