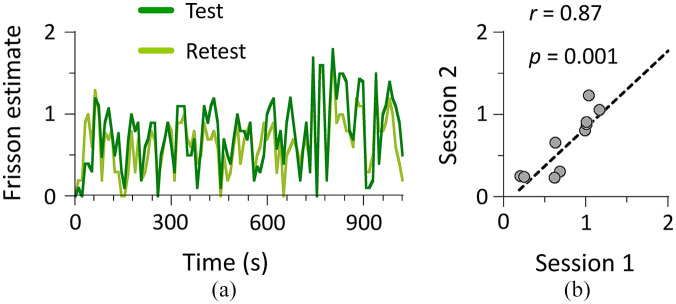
Figure 1.
Results of Experiment 1 (N = 10). (a) Time-series data of averaged frisson estimate. Participants attended two test sessions (total duration of 1,020 s for each) that were conducted 2 weeks apart. They continuously indicated intensity of frisson using 3-point Likert-type scale while dichotically listening to auditory stimuli through headphones. (b) Circles in correlation plot represent mean frisson estimate over entire stimulus presentation.

