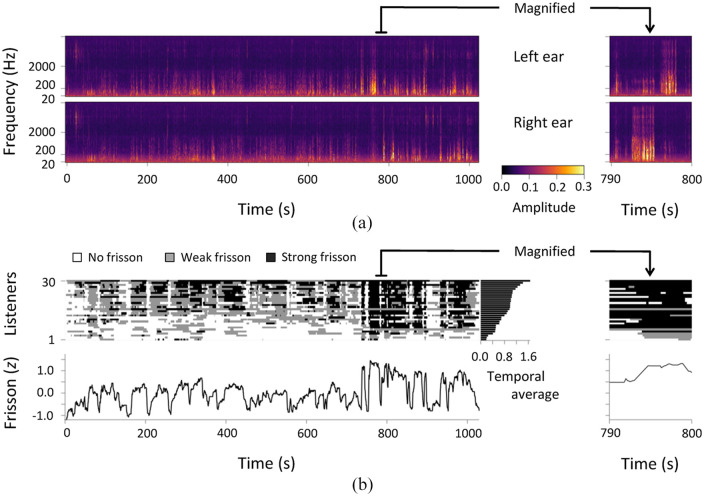
Figure 2.
Auditory stimuli and frisson estimate. (a) Cochlea spectrograms of stimuli recorded by artificial ear. (b) Results of frisson estimate (z-score) in Experiment 2 (N = 30). Top and bottom panels represent time-series data for each participant and averaged z-score across participants, respectively.

