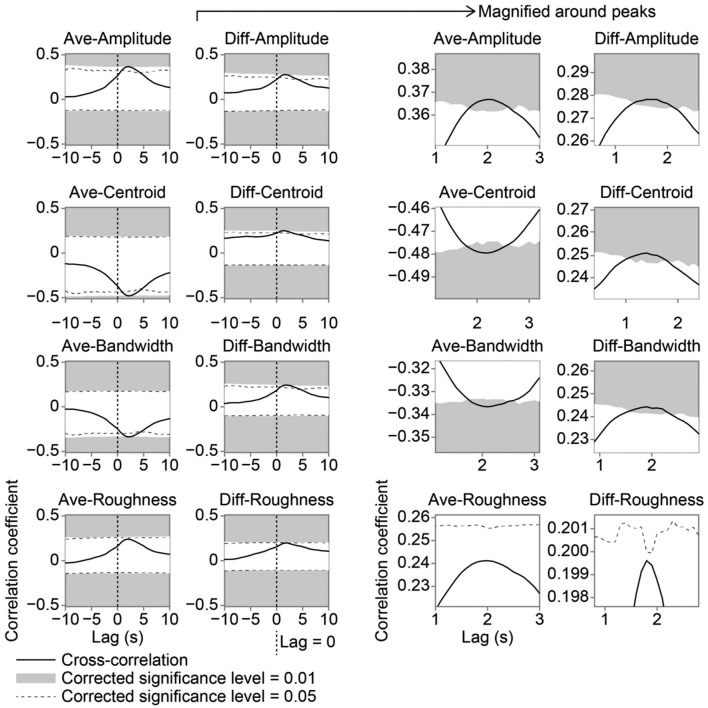
Figure 4.
Cross-correlations between frisson estimate (z-score) and acoustic features. Areas shaded in grey and dashed lines represent statistical significance after Bonferroni correction over eight features. Right panels show magnified plots around peaks of cross-correlations. Positive time lag indicates that changes in acoustic features are followed by frisson.

