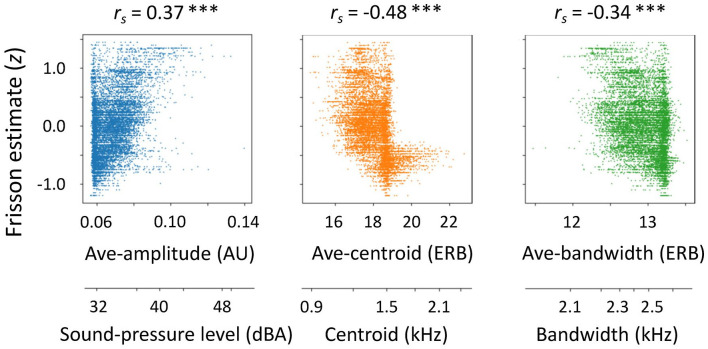
Figure 5.
Correlations between frisson estimate (z-score) and acoustic features. Frisson estimate is shifted by peak lags of cross-correlations. Dots represent data for each time point (100 ms bin) throughout experimental trial. When Ave-amplitude feature was larger, frisson estimate was greater. Sound-pressure level (around 40 dBA) of stimuli was generally low. In contrast, when Ave-centroid and Ave-bandwidth features were smaller, frisson estimate was greater. Number lines below panels indicate physical dimensions transformed from acoustic feature values.
AU: arbitrary unit; ERB: equivalent rectangular bandwidth scale; rs: Spearman’s rank correlation coefficient.
***p < .001 (corrected for multiple comparisons).

