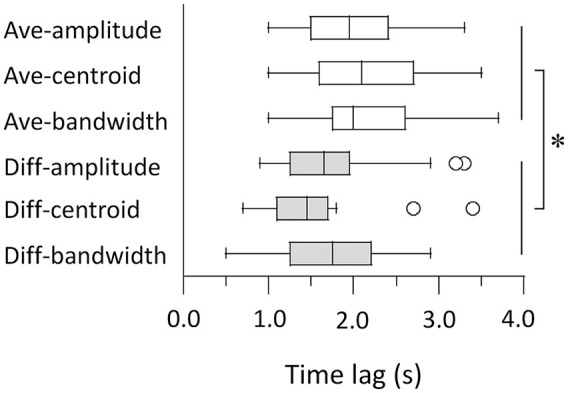
Figure 6.

Time lags of peak cross-correlations for acoustic features. Box-and-whisker plots indicate median, 25th and 75th percentiles, and outliers for distribution across participants.
*p < .05.

Time lags of peak cross-correlations for acoustic features. Box-and-whisker plots indicate median, 25th and 75th percentiles, and outliers for distribution across participants.
*p < .05.