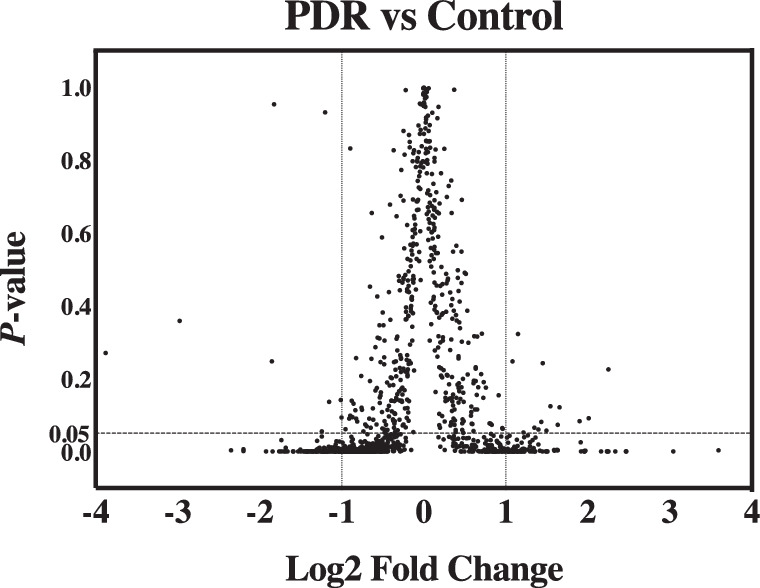
Figure 1.

Volcano plot visualization of differentially expressed proteins. X-axis is the log2 of fold change (PDR group/control group). Y-axis is P value for independent t-test corrected by Benjamini–Hochberg procedure. Vertical dashed lines represent two-fold change in either direction (PDR/control or control/PDR). Horizontal dashed line represents a cutoff of P value 0.05. All 191 significantly differentially expressed proteins (|log2 (fold change)| ≥ 1 and P < 0.05) fall to the left or right of vertical dashed lines and under the horizontal dashed line.
