Figure.

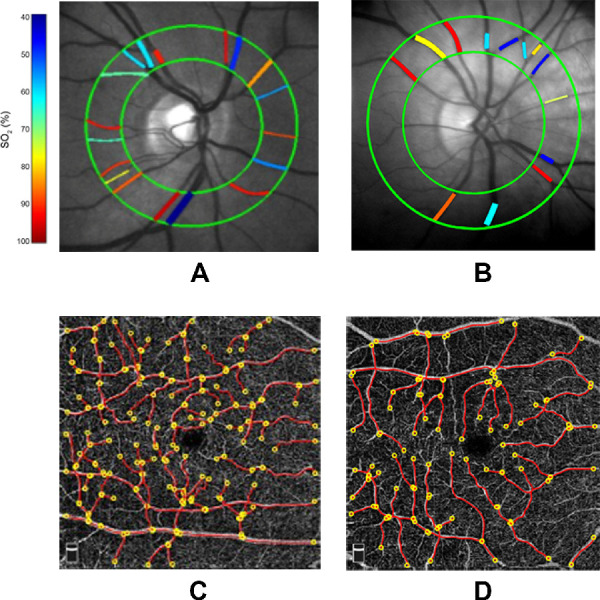
Examples of retinal images obtained in a (A) control subject and (B) moderate to severe nonproliferative diabetic retinopathy subject. Retinal vascular oxygen saturation (SO2) measurements in major arteries and veins are depicted in pseudo-color within a circumpapillary region bounded by green circles. Examples of optical coherence tomography angiography images acquired in the same (C) control subject and (D) moderate to severe nonproliferative diabetic retinopathy subject. Vessel centerlines (red lines) are overlaid on the vessels and vessel end points are indicated by yellow circles. Vessel tortuosity index (VTI) was determined by averaging measurements from all vessels.
