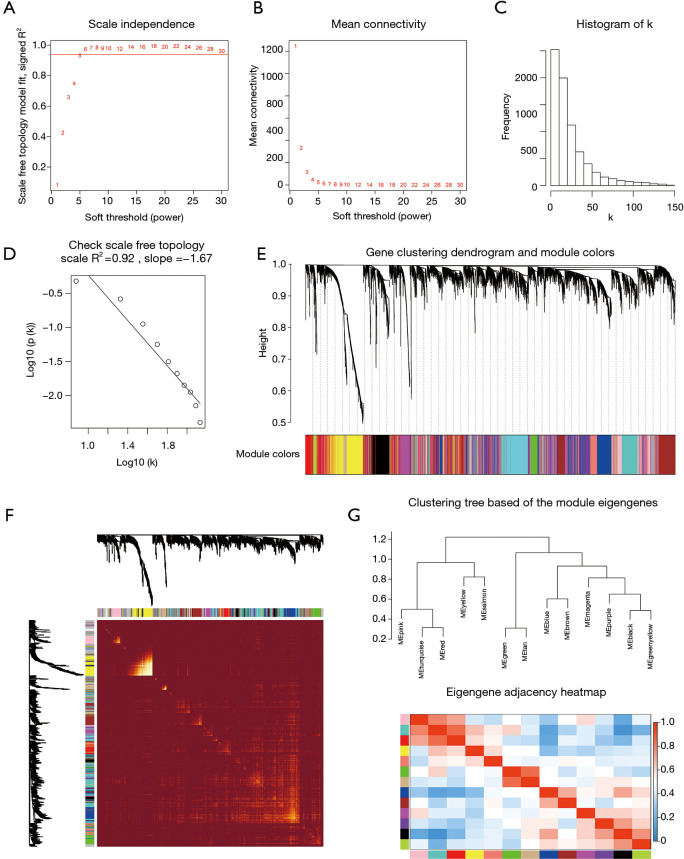
Figure 3.
Determination of soft-thresholding power and construction of co-expression modules. (A) Analysis of the scale‐free fit index for various soft‐thresholding powers (β). (B) Analysis of the mean connectivity for various soft‐thresholding powers. (C) Histogram of connectivity distribution when β =5. (D) Checking the scale‐free topology when β =5. The approximate straight-line relationship (high R2 value) shows approximate scale-free topology. (E) Gene clustering dendrogram was obtained by the hierarchical clustering of TOM-based dissimilarity. The color row below the dendrogram indicates module colors. (F) Heatmap plot of the topological overlap matrix among 1000 randomly selected genes. Rows and columns correspond to single genes. Light colors represent higher topological overlap and progressively darker colors represent lower topological overlap. (G) Hierarchical clustering dendrogram and heat map of module eigengenes. Colors represent the intensity of adjacency. TOM, topological overlap measure.

