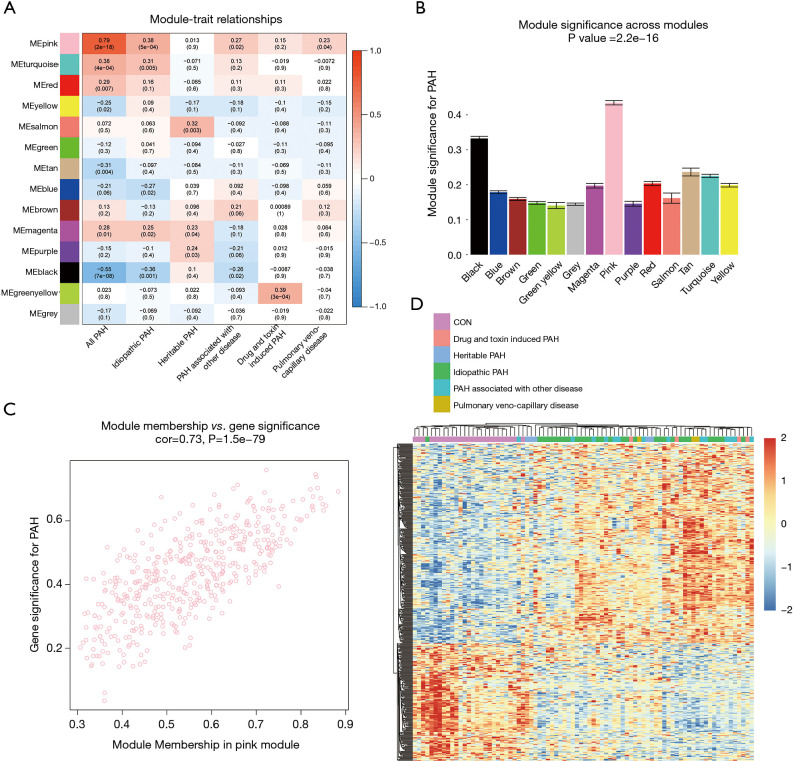
Figure 4.
Modules related to clinical trait and functional enrichment. (A) Heatmap of the correlation between module eigengenes and clinical traits. Each cell contains the corresponding correlation coefficient and P value. (B) Bar plot of module significance for PAH. Error bars represent the standard error of GS in each module. (C) Scatterplot of GS for PAH vs. MM in the pink module. (D) Heatmap showed 471 genes in the pink module. Annotation bar represents the subgroups of PAH. PAH, pulmonary artery hypertension.

