Figure 5.
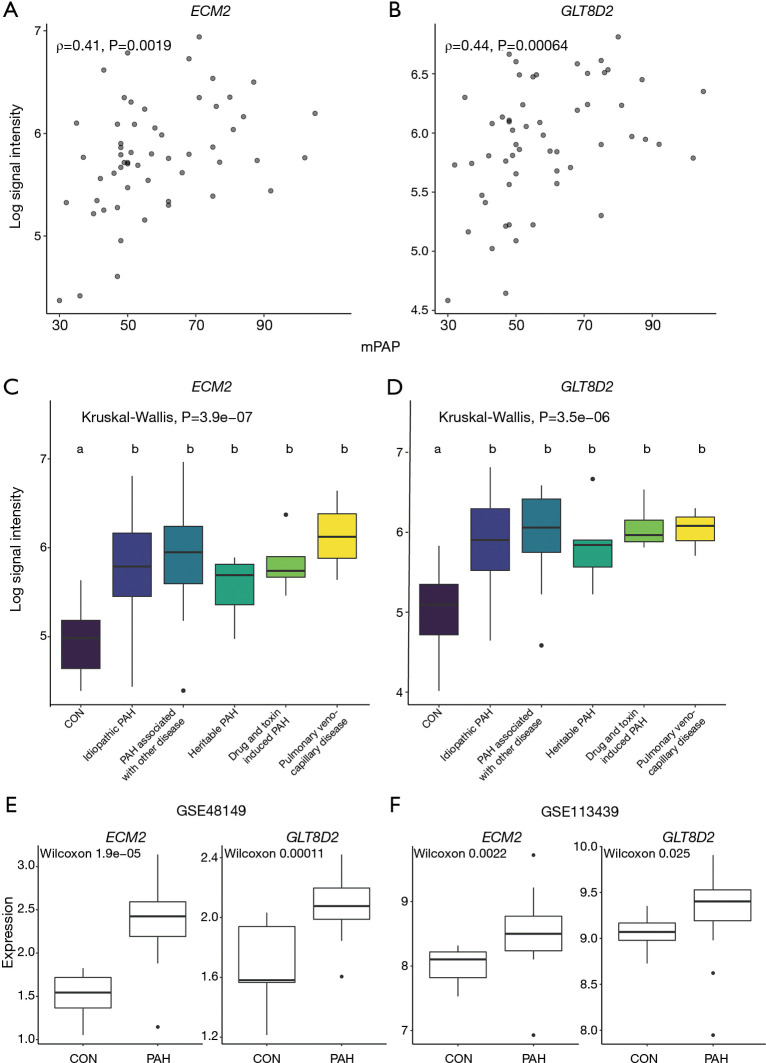
Identification and validation of hub genes. Scatter plot to visualize the relationship between hub genes ECM2 (A), GLT8D2 (B) and the value of mPAP. Expression levels of hub genes ECM2 (C), GLT8D2 (D) between different PAH subtypes. Kruskal-Wallis H test was used to evaluate the statistical difference. The different letter marks significant difference. Validation of hub genes through independent datasets GSE48149 (E) and GSE113439 (F). Wilcoxon signed-rank test was used to evaluate the statistical significance of differences. mPAP, mean pulmonary artery pressure; PAH, pulmonary artery hypertension.

