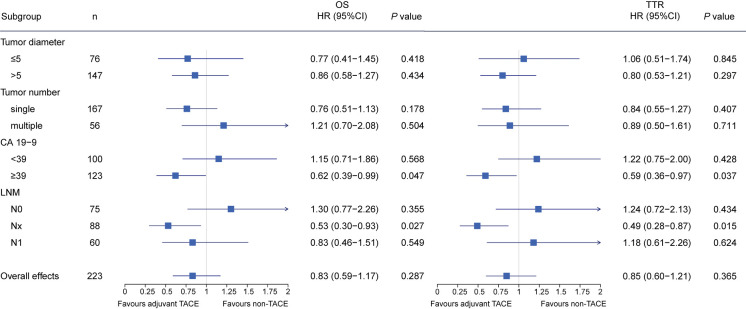
Figure 3.
Forest plot of impacts of adjuvant TACE on OS and tumor recurrence in subgroup patients after IPTW analysis. Squares represent point estimates for the hazard ratio as compared with non-TACE, and horizontal lines indicate the associated 95% CIs. Hazard ratios and P values were estimated with the use of propensity-weighted Cox proportional-hazards models. OS, overall survival; TTR, time to recurrence; IPTW, inverse probability of treatment weighting; TACE, transarterial chemoembolization.

