Figure 1.

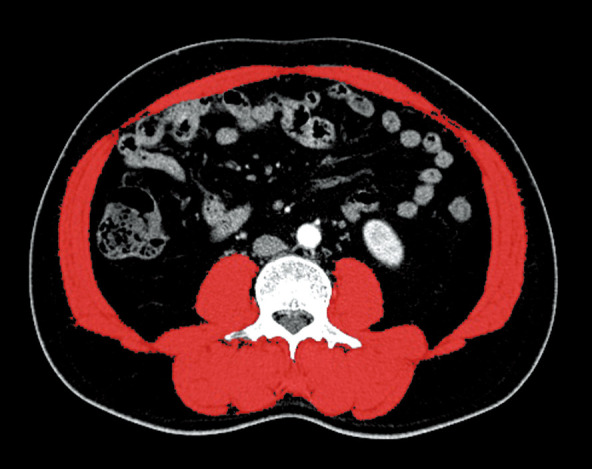
Cross-sectional CT image at the third lumbar vertebra level. The red shadows show the skeletal muscle areas, which were identified and quantified at –29 to 150 Hu. CT, computed tomography; Hu, Hounsfield units.

Cross-sectional CT image at the third lumbar vertebra level. The red shadows show the skeletal muscle areas, which were identified and quantified at –29 to 150 Hu. CT, computed tomography; Hu, Hounsfield units.