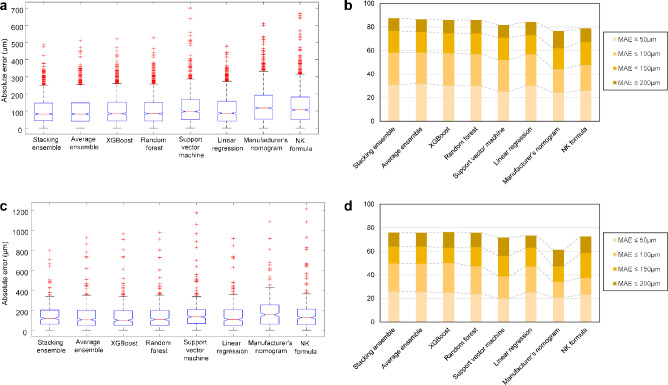
Figure 7.
Comparison of postoperative ICL vault prediction performance in the internal and external validation datasets. (A) Box plot of the absolute error values for the predicted vault in the internal validation dataset. (B) Proportions of eyes within a given range of absolute errors for the predicted vault in the internal validation dataset. (C) Box plot of the absolute error values for the predicted vault in the external validation dataset. (D) Proportions of eyes within a given range of absolute errors for the predicted vault in the external validation dataset.

